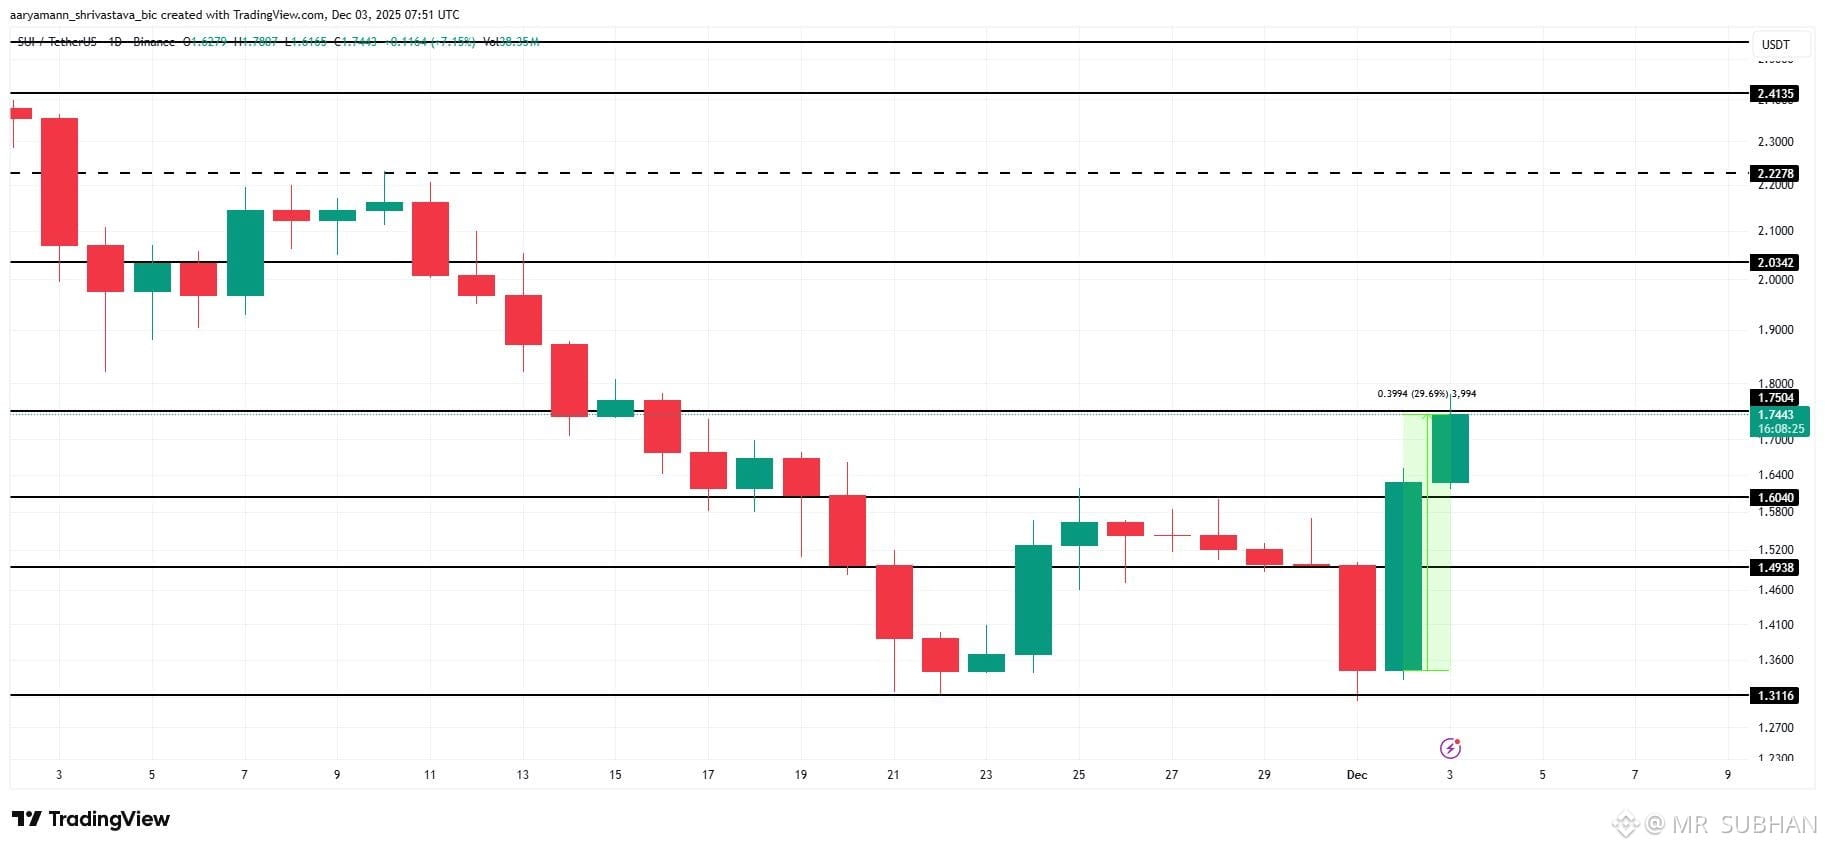
$SUI WILL RECOVER My LOSS ???
#BinanceReopensWithdrawalsForMoreAssets #USMidtermElections
Breakout and continuation
If $SUI I closes a strong 4-hour candle above $0.9030, with increasing volume:
First target: $0.9144
Second target: $0.9172
Extended target: $0.9620
Confirmation: a breakout followed by a successful retest.
Rejection and continuation downward
If SUI fails at $0.8988–$0.9030 and breaks below $0.8872:
First target: $0.8665
Second target: $0.8595
Extended target: $0.8350
Confirmation: a strong bearish candle with expanding volume.
Range-bound trading
If price stays between approximately $0.8870 and $0.9030, SUI may consolidate.
15-minute 🟢 Bullish Short-term recovery
1-hour 🟡 Neutral Momentum improving
4-hour 🔴 Bearish Larger trend still weak
Daily 🔴 Bearish Below major moving averages
Weekly 🟡 Mixed Recovery not confirmed
Source:
Candlestick pattern analysis
Bullish hammer: A recent 5-hour hammer suggests buyers defended lower prices.
Bullish harami: A short-term reversal signal has appeared on the 1-hour chart.
Bearish engulfing: Sellers have also appeared on the 1-hour chart, showing resistance remains strong.
Rising wedge: A short-term 15-minute pattern is developing, which can warn of a pullback.
Resistance 3 $0.9620
Resistance 2 $0.9144 – $0.9172
Resistance 1 $0.8988 – $0.9030
CURRENT PRICE ZONE
$0.89–$0.90
Support 1 $0.8872
Support 2 $0.8595 – $0.8665
Support 3 $0.8277 – $0
#BinanceReopensWithdrawalsForMoreAssets #USMidtermElections
Breakout and continuation
If $SUI I closes a strong 4-hour candle above $0.9030, with increasing volume:
First target: $0.9144
Second target: $0.9172
Extended target: $0.9620
Confirmation: a breakout followed by a successful retest.
Rejection and continuation downward
If SUI fails at $0.8988–$0.9030 and breaks below $0.8872:
First target: $0.8665
Second target: $0.8595
Extended target: $0.8350
Confirmation: a strong bearish candle with expanding volume.
Range-bound trading
If price stays between approximately $0.8870 and $0.9030, SUI may consolidate.
15-minute 🟢 Bullish Short-term recovery
1-hour 🟡 Neutral Momentum improving
4-hour 🔴 Bearish Larger trend still weak
Daily 🔴 Bearish Below major moving averages
Weekly 🟡 Mixed Recovery not confirmed
Source:
Candlestick pattern analysis
Bullish hammer: A recent 5-hour hammer suggests buyers defended lower prices.
Bullish harami: A short-term reversal signal has appeared on the 1-hour chart.
Bearish engulfing: Sellers have also appeared on the 1-hour chart, showing resistance remains strong.
Rising wedge: A short-term 15-minute pattern is developing, which can warn of a pullback.
Resistance 3 $0.9620
Resistance 2 $0.9144 – $0.9172
Resistance 1 $0.8988 – $0.9030
CURRENT PRICE ZONE
$0.89–$0.90
Support 1 $0.8872
Support 2 $0.8595 – $0.8665
Support 3 $0.8277 – $0