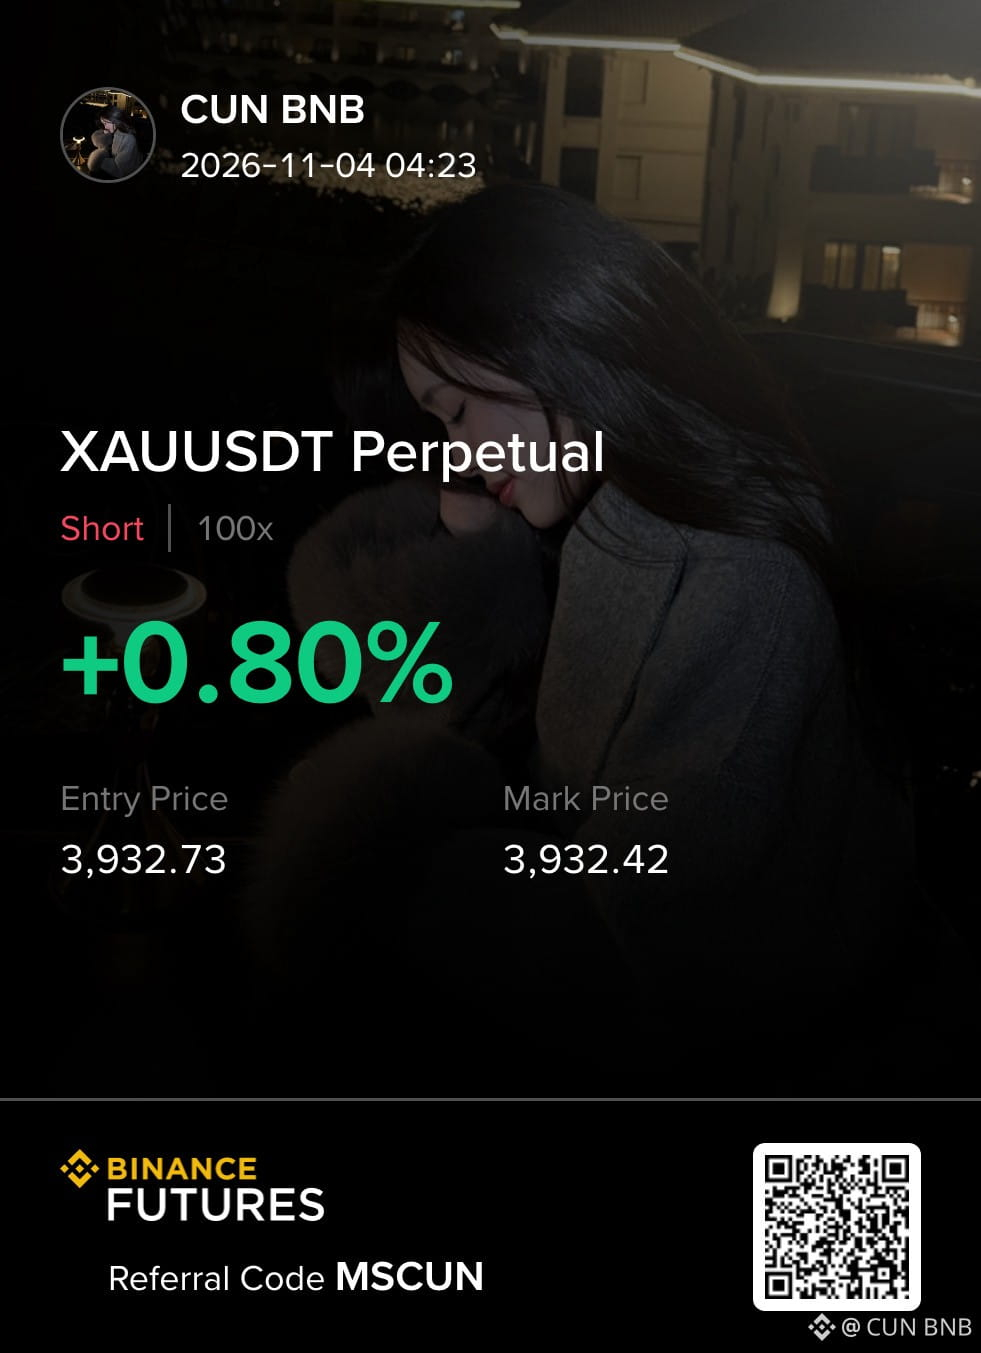
$XAU - my bias remains SHORT (x100)
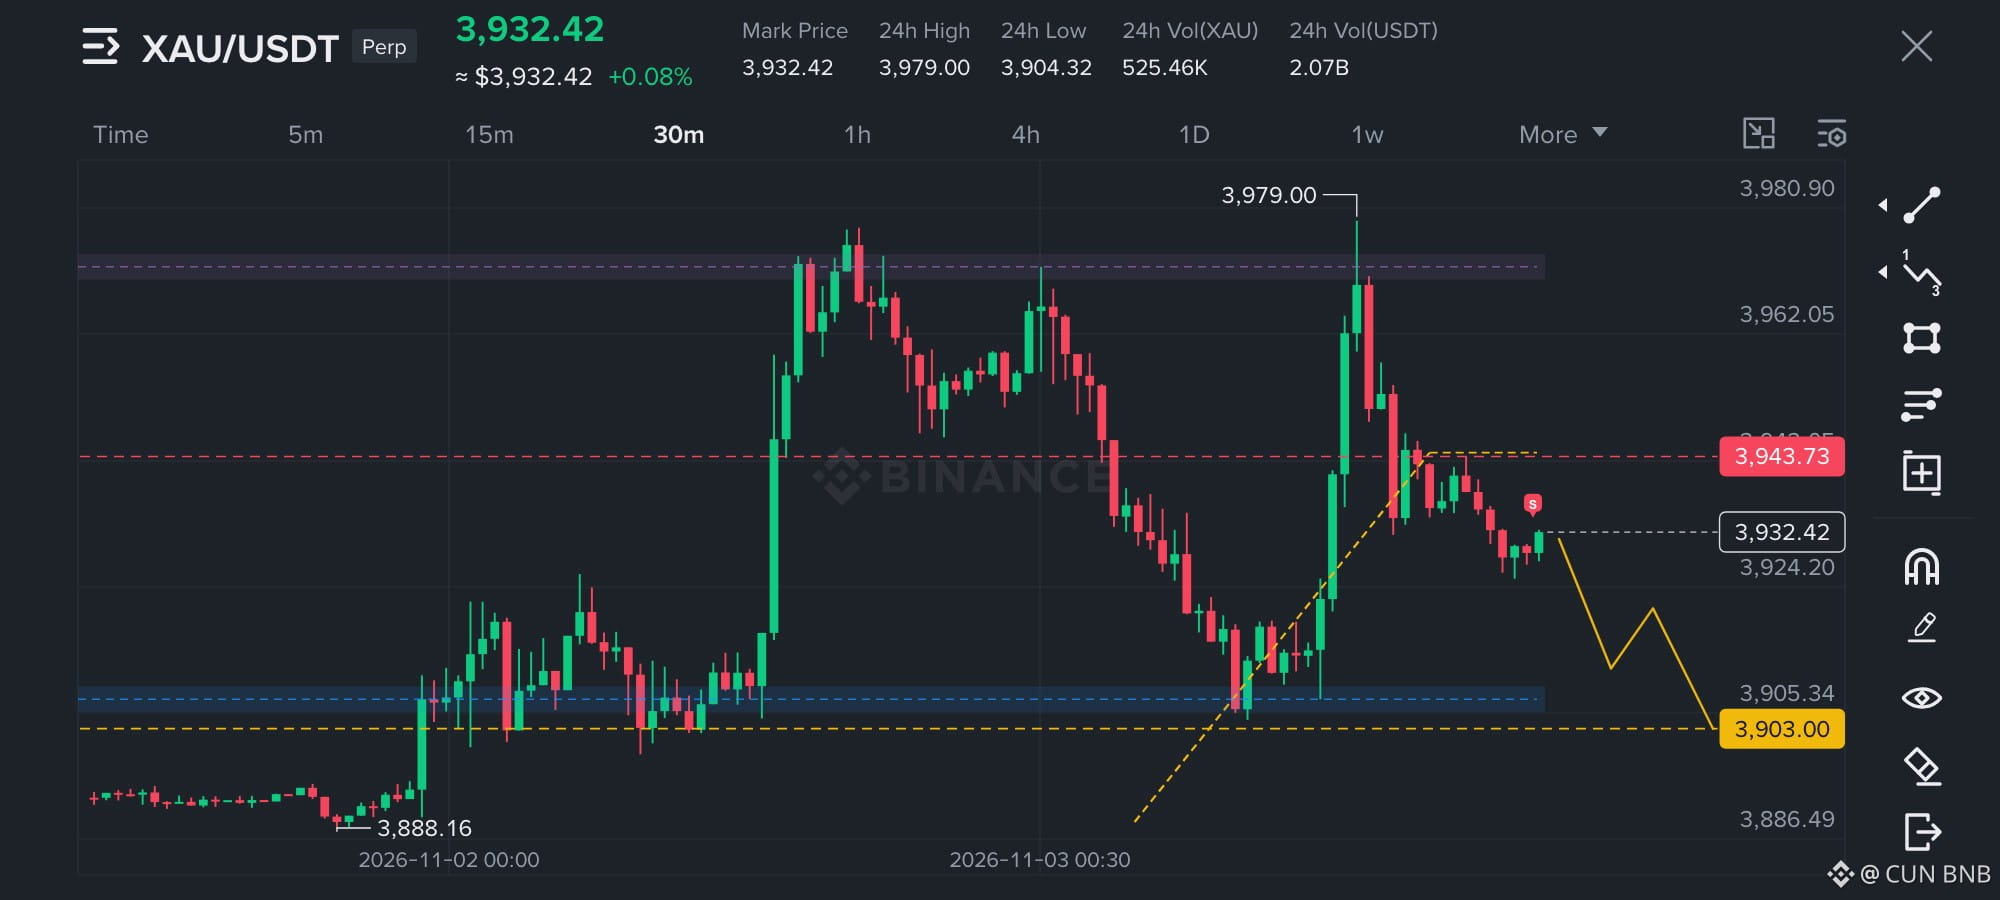
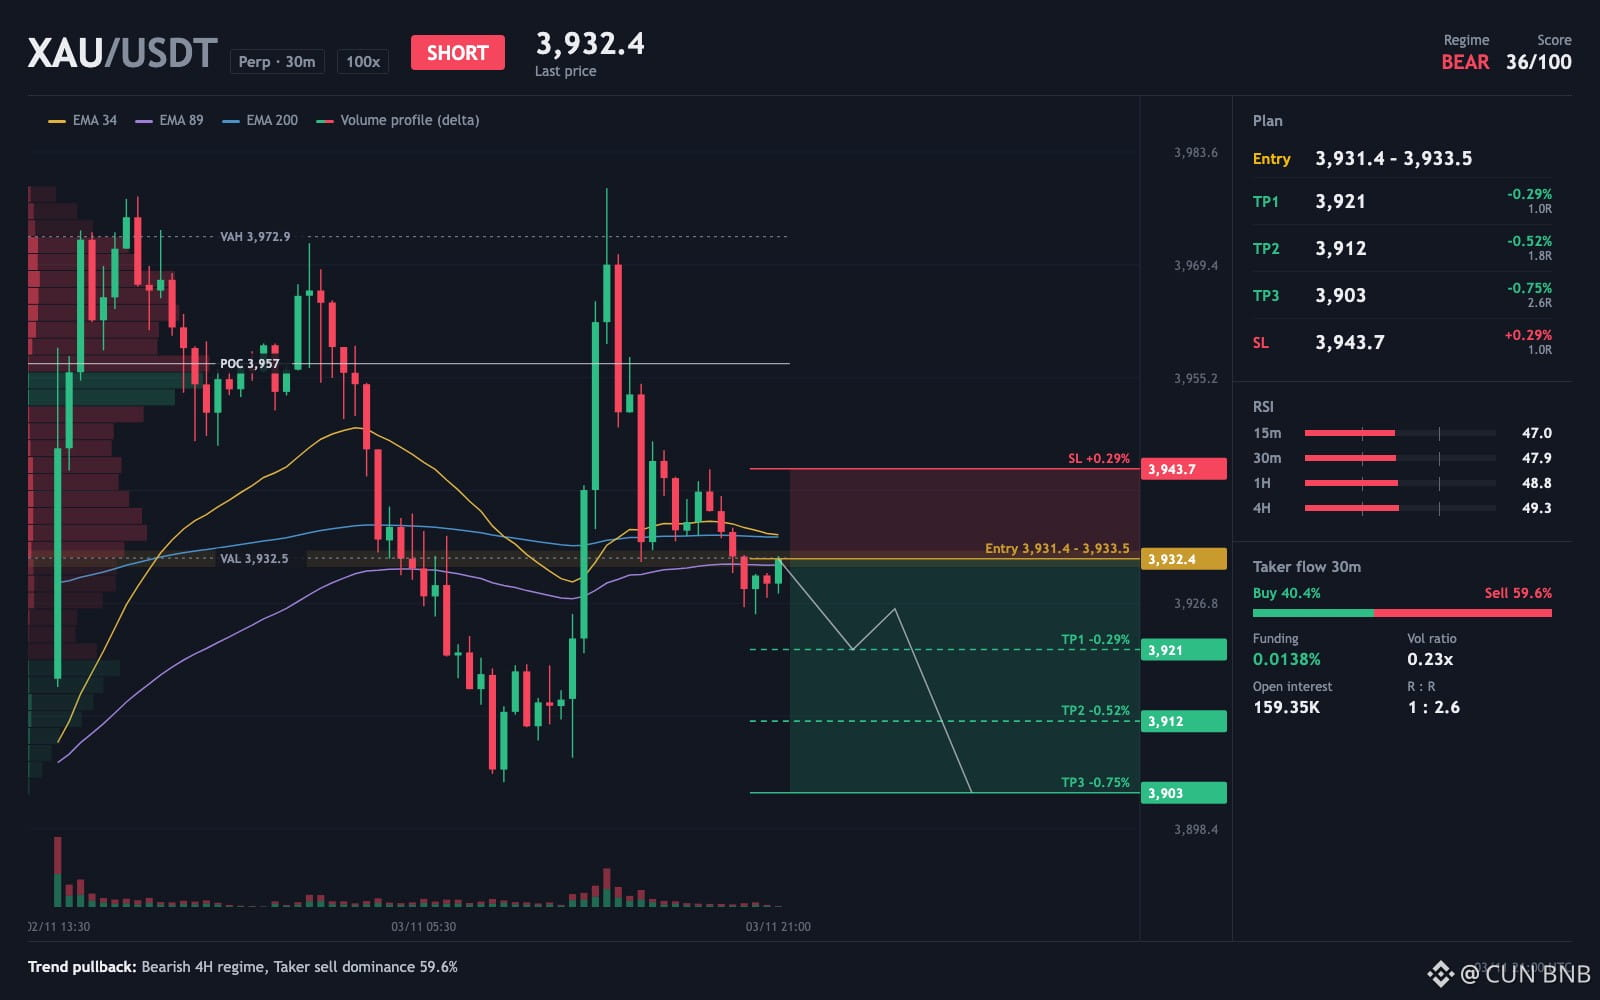
On the 30-minute chart $XAU sits just 0.1% above its 200 EMA. How do you read that?
Price is pressed right up against its long-term average, so the trend on that chart has barely had room to form. What gets me here is how tight the whole setup is, with the stop 0.3% from entry and the first target the same 0.3% away, while the 4-hour trend still points down.
That closeness to the 200 EMA is the very thing that could undercut a short, since a hold above it keeps the trend undecided. The plan's condition stays open until price clearly separates from 3931.38.
Setup:
Entry: 3931.38–3933.46
TP1: 3921
TP2: 3912
TP3: 3903
SL: 3943.73
⚠️ Personal market insight, not investment advice. DYOR.
On the 30-minute chart $XAU sits just 0.1% above its 200 EMA. How do you read that?
Price is pressed right up against its long-term average, so the trend on that chart has barely had room to form. What gets me here is how tight the whole setup is, with the stop 0.3% from entry and the first target the same 0.3% away, while the 4-hour trend still points down.
That closeness to the 200 EMA is the very thing that could undercut a short, since a hold above it keeps the trend undecided. The plan's condition stays open until price clearly separates from 3931.38.
Setup:
Entry: 3931.38–3933.46
TP1: 3921
TP2: 3912
TP3: 3903
SL: 3943.73
⚠️ Personal market insight, not investment advice. DYOR.