DAILY SIGNAL — SOL/USDT
Date: 04 Nov 2026
Chart Time: 03:44 UTC+8
Timeframe: 1m
Intraday Bias: Bearish continuation → downside liquidity test
---
📊 MARKET BIAS
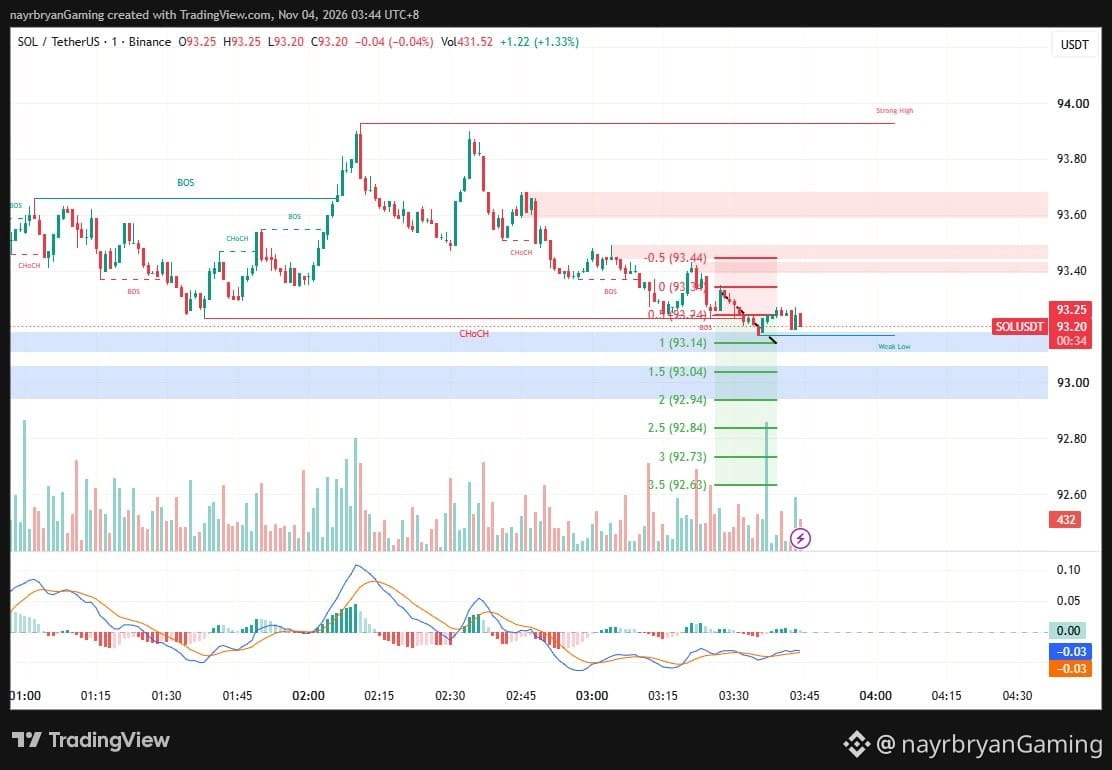
SOL remains under short-term bearish pressure after experiencing repeated rejections from the upper supply zones.
Price previously attempted to recover toward the 93.40–93.48 resistance area but failed to maintain bullish momentum.
The subsequent decline pushed price toward the blue weak-low support zone around 93.14.
Current price is approximately 93.20, indicating that SOL is still trading close to the lower structure.
The immediate question is whether buyers can defend the 93.14 area or sellers will push price toward the next Fibonacci extensions.
---
🔹 KEY LEVELS FROM CHART
Current Price:
93.20
Immediate Resistance:
93.24
Key Resistance Zone:
93.34–93.44
Major Supply Zone:
93.58–93.68
Strong High:
93.92
Immediate Support / Weak Low:
93.14
Secondary Support Zone:
93.04–92.94
---
🎯 FIBONACCI LEVELS
Upside Recovery References:
93.24 → 93.34 → 93.44
Downside Targets:
TP1 → 93.14 (1.0 Fib)
TP2 → 93.04 (1.5 Fib)
TP3 → 92.94 (2.0 Fib)
TP4 → 92.84 (2.5 Fib)
TP5 → 92.73 (3.0 Fib)
TP6 → 92.63 (3.5 Fib)
Additional Resistance Reference:
93.44 (-0.5 Fib)
---
📈 TECHNICAL BREAKDOWN
1. Price Structure
SOL has developed a sequence of lower highs following rejection from the upper supply region.
The 93.40–93.48 area acted as an important rejection zone, while the subsequent selling pressure pushed price toward 93.14.
---
🧠 QUICK INSIGHT
"Support is where buyers get tested. A breakdown reveals whether sellers still control the structure."
---
⚠️ DISCLAIMER
This is personal market analysis for educational purposes only, not financial advice or a guaranteed prediction.
Always DYOR / DYODD, manage risk properly, and avoid emotional trading.
— @nayrbryanGaming
#SOL #SOLUSDT #Crypto #Trading #TechnicalAnalysis #PriceAction #Fibonacci #Binance #MACD #SmartMoney #DYOR #NFA #NoFOMO
Date: 04 Nov 2026
Chart Time: 03:44 UTC+8
Timeframe: 1m
Intraday Bias: Bearish continuation → downside liquidity test
---
📊 MARKET BIAS
SOL remains under short-term bearish pressure after experiencing repeated rejections from the upper supply zones.
Price previously attempted to recover toward the 93.40–93.48 resistance area but failed to maintain bullish momentum.
The subsequent decline pushed price toward the blue weak-low support zone around 93.14.
Current price is approximately 93.20, indicating that SOL is still trading close to the lower structure.
The immediate question is whether buyers can defend the 93.14 area or sellers will push price toward the next Fibonacci extensions.
---
🔹 KEY LEVELS FROM CHART
Current Price:
93.20
Immediate Resistance:
93.24
Key Resistance Zone:
93.34–93.44
Major Supply Zone:
93.58–93.68
Strong High:
93.92
Immediate Support / Weak Low:
93.14
Secondary Support Zone:
93.04–92.94
---
🎯 FIBONACCI LEVELS
Upside Recovery References:
93.24 → 93.34 → 93.44
Downside Targets:
TP1 → 93.14 (1.0 Fib)
TP2 → 93.04 (1.5 Fib)
TP3 → 92.94 (2.0 Fib)
TP4 → 92.84 (2.5 Fib)
TP5 → 92.73 (3.0 Fib)
TP6 → 92.63 (3.5 Fib)
Additional Resistance Reference:
93.44 (-0.5 Fib)
---
📈 TECHNICAL BREAKDOWN
1. Price Structure
SOL has developed a sequence of lower highs following rejection from the upper supply region.
The 93.40–93.48 area acted as an important rejection zone, while the subsequent selling pressure pushed price toward 93.14.
---
🧠 QUICK INSIGHT
"Support is where buyers get tested. A breakdown reveals whether sellers still control the structure."
---
⚠️ DISCLAIMER
This is personal market analysis for educational purposes only, not financial advice or a guaranteed prediction.
Always DYOR / DYODD, manage risk properly, and avoid emotional trading.
— @nayrbryanGaming
#SOL #SOLUSDT #Crypto #Trading #TechnicalAnalysis #PriceAction #Fibonacci #Binance #MACD #SmartMoney #DYOR #NFA #NoFOMO