📊 $BNB Analysis (Nov 3, 2026): Key Levels Every Trader Should Watch
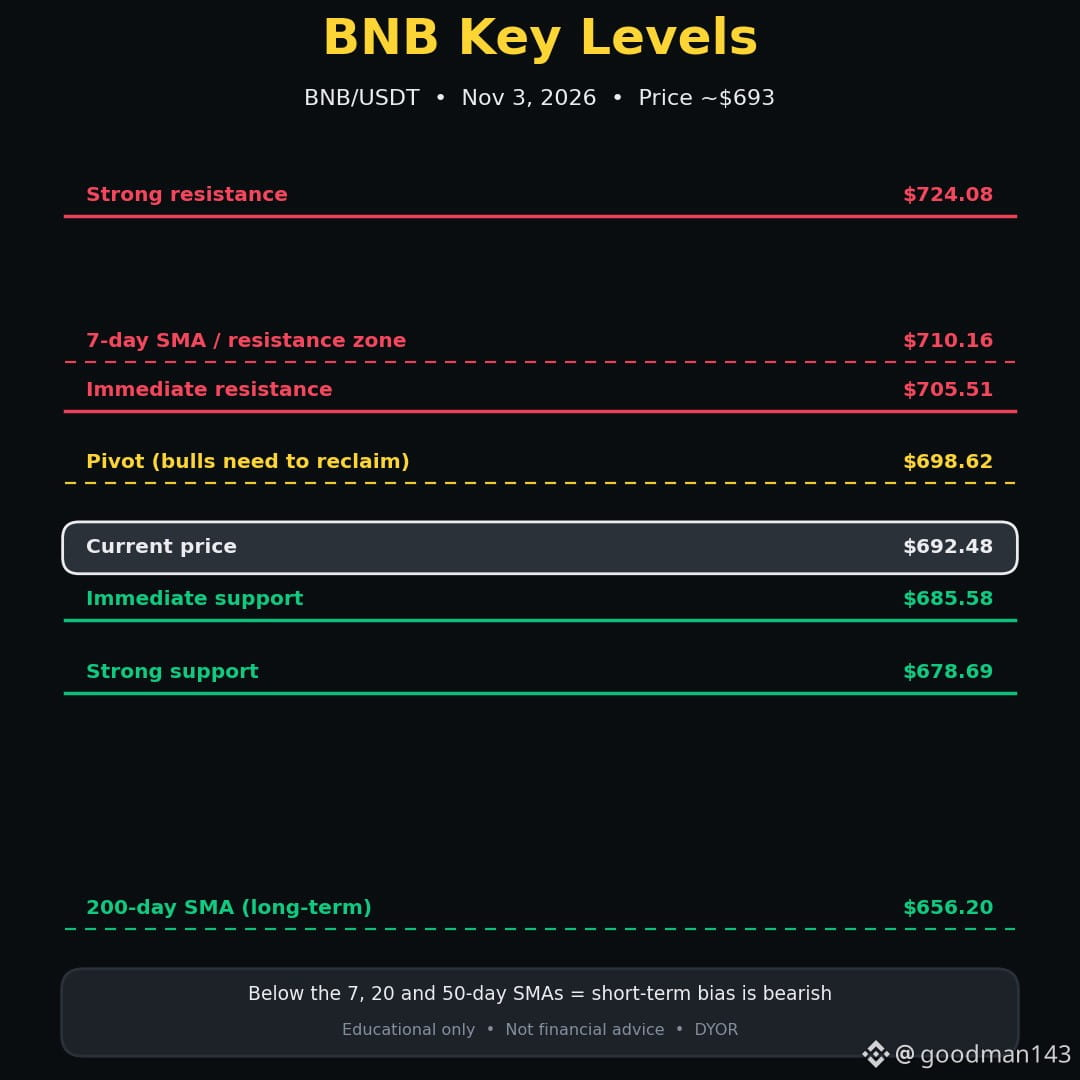
$BNB is trading around $692, down about 2% in 24h, while the whole market is in Fear (Fear & Greed Index: 26). Here is what the chart is saying:
📉 Trend: Price is below the 7-day ($710), 20-day ($726) and 50-day ($748) moving averages, so the short-term bias is bearish.
🛡️ Long-term: It is still above the 200-day SMA (~$656), so the bigger trend has not broken.
🔴 Resistance: $705.5 → $710 → $724
🟢 Support: $685.6 → $678.7 → $656 (200-day SMA)
⚖️ Pivot: ~$698.6
🧠 Two scenarios to watch:
1️⃣ Bullish: A reclaim of the $698–$705 zone would shift the short-term structure toward neutral, with $710+ as the next test.
2️⃣ Bearish: A daily close below $685 opens the door to $678 and possibly the 200-day SMA near $656.
⚠️ Risk tip: If you trade this, use a stop-loss and size your position small. In a fear market, volatility can be high and fakeouts are common.
🌍 Market context: $BTC is near $76.6K with support ~$76,000 and resistance ~$78,500. If $BTC breaks down, $BNB and $ETH usually feel it too.
👇 Are you bullish or bearish on BNB from here? Vote in the poll below and tell me why in the comments!
#Binance #BinanceSquare #BNB #BNBChain #Bitcoin #TechnicalAnalysis #CryptoTrading #SupportAndResistance
This is educational analysis, not financial advice. Prices are approximate and change fast. Always DYOR.
$BNB is trading around $692, down about 2% in 24h, while the whole market is in Fear (Fear & Greed Index: 26). Here is what the chart is saying:
📉 Trend: Price is below the 7-day ($710), 20-day ($726) and 50-day ($748) moving averages, so the short-term bias is bearish.
🛡️ Long-term: It is still above the 200-day SMA (~$656), so the bigger trend has not broken.
🔴 Resistance: $705.5 → $710 → $724
🟢 Support: $685.6 → $678.7 → $656 (200-day SMA)
⚖️ Pivot: ~$698.6
🧠 Two scenarios to watch:
1️⃣ Bullish: A reclaim of the $698–$705 zone would shift the short-term structure toward neutral, with $710+ as the next test.
2️⃣ Bearish: A daily close below $685 opens the door to $678 and possibly the 200-day SMA near $656.
⚠️ Risk tip: If you trade this, use a stop-loss and size your position small. In a fear market, volatility can be high and fakeouts are common.
🌍 Market context: $BTC is near $76.6K with support ~$76,000 and resistance ~$78,500. If $BTC breaks down, $BNB and $ETH usually feel it too.
👇 Are you bullish or bearish on BNB from here? Vote in the poll below and tell me why in the comments!
#Binance #BinanceSquare #BNB #BNBChain #Bitcoin #TechnicalAnalysis #CryptoTrading #SupportAndResistance
This is educational analysis, not financial advice. Prices are approximate and change fast. Always DYOR.