
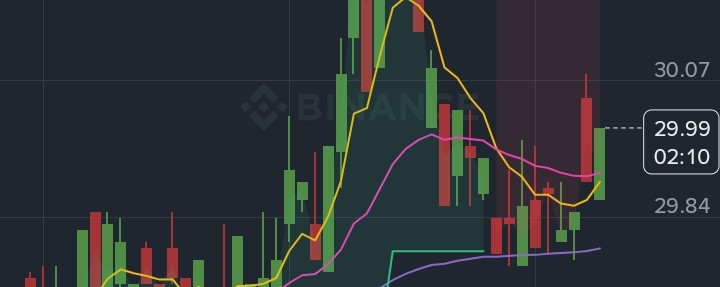

### $TMFB /USDT – Strong Price Prediction

Direxion Daily 20+ Year Treasury Bull 3X ETF | 3 November 2026
My initial prediction: TMFb has a cautiously bullish short-term setup, but it needs to break $30.07–$30.29 to confirm stronger upside.
Your screenshot shows TMFb trading at $29.99, up 0.40%.
This asset is especially sensitive to US Treasury yields, Federal Reserve interest-rate expectations, inflation and geopolitical risk.
### 1\. Technical analysis – 1-hour chart
| Indicator | Value | Signal |
| ------------- | ------ | ---------------- |
| Current price | $29.99 | Positive |
| EMA 7 | $29.90 | Bullish |
| EMA 25 | $29.92 | Slightly bullish |
| EMA 99 | $29.79 | Supportive |
| Supertrend | $30.29 | Bearish |
| 24h high | $30.47 | Resistance |
| 24h low | $29.75 | Support |
Important observation: All three EMAs are below the current price. This is encouraging, but Supertrend remains bearish.
### 2\. International financial market
The latest available market reports show mixed signals:
* US 10-year Treasury yield was around 4.914% in early European trading on November 3. Higher yields are negative for TMF. WSJ
* Earlier, falling oil prices and US-Iran diplomatic efforts helped Treasury prices recover. WSJ
* Reuters reports that Iran-related energy inflation, government borrowing and geopolitical risks remain major threats to global bond markets. Reuters
War impact: If the Iran conflict pushes oil prices higher, inflation fears could increase and Treasury yields could rise. That would hurt TMF. If diplomatic progress reduces oil prices and inflation fears, TMF could benefit.
### 3\. What makes TMF move?
Direxion Daily 20+ Year Treasury Bull 3X ETF is not an ordinary company stock.
It aims to deliver 3 times the DAILY performance of a long-term US Treasury bond index, before fees and expenses. Direxion
Important financial factors:
* Federal Reserve interest-rate decisions.
* US inflation and employment reports.
* US Treasury bond auctions and government borrowing.
* 20–30-year Treasury yields.
* Geopolitical risk and safe-haven demand.
There is also an important risk: daily leverage compounds. Holding TMF for weeks or months can produce returns very different from three times the underlying index's cumulative return.
### 4\. My price prediction
Based on your $29.99 screenshot price. These are scenario estimates, not guaranteed targets.
### TMFb forecast
Next 24–72 hours
| Level | Price |
| ----------------- | ------ |
| First resistance | $30.07 |
| Second resistance | $30.29 |
| Major resistance | $30.47 |
| Bullish target | $30.80 |
| First support | $29.84 |
| Strong support | $29.75 |
| Breakdown support | $29.44 |
My scenario assessment
Bullish
40%
Sideways
35%
Bearish
25%
Subjective probabilities, not statistical forecasts.
### 5\. Trading strategy
Potential buy setup
My preferred strategy:
* Entry zone: $29.85–$29.95, if support holds.
* Confirmation: 1-hour candle closes above $30.07.
* Target 1: $30.29.
* Target 2: $30.47.
* Target 3: $30.80.
* Stop-loss: approximately $29.68.
If price closes below $29.75, avoid buying immediately. A move toward $29.44 becomes possible.
### 6\. Final verdict
### CAUTIOUSLY BULLISH
My prediction: TMFb could attempt $30.29–$30.47 in the short term.
But a confirmed breakout above $30.29 is needed before expecting $30.80.
A fall below $29.75 would invalidate the immediate bullish setup.
### 7\. Tell me your position
Have you bought TMFb?
Not bought
yet
Already bought
Your buying price (USDT)
Holding period
24 hours
3 days
7 days
30 days
Calculate my TMFb strategy
#USMidtermElections #USOctoberNFP-AreRateCutsStillPossible #Verify1to1BinanceReserves $TMFB