🚨 $TRB: Is This the Calm Before a Major Move? 👀📈
The weekly chart of Tellor ($TRB ) is telling an interesting story.
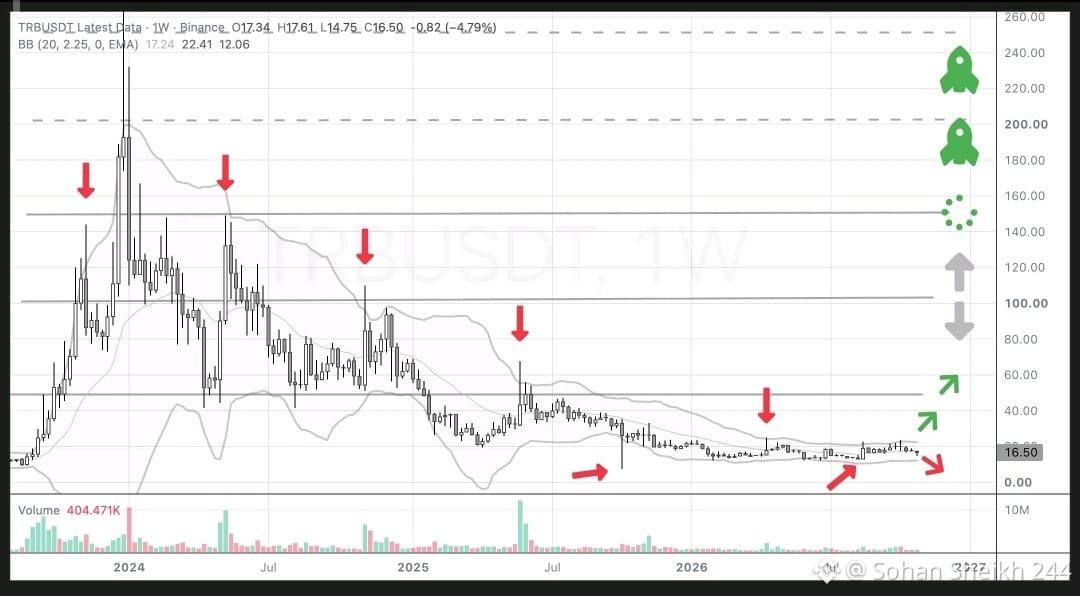
After a massive rally in 2024, TRB experienced a prolonged correction. But now, something interesting is happening — price action is becoming much tighter, and volatility appears to be cooling down.
🔍 WHAT THE WEEKLY CHART SHOWS:
1️⃣ Long-Term Downtrend: TRB has been making lower highs for a long time. The bigger trend has not fully reversed yet.
2️⃣ Important Support Zone: The $10–$12 area is worth watching as a potential support region.
3️⃣ First Resistance: The $20–$25 zone could become an important test for bullish momentum.
4️⃣ Bollinger Bands: Price is trading around the middle-to-lower portion of the weekly Bollinger Bands. A volatility expansion could bring a stronger move.
🎯 TWO POSSIBLE SCENARIOS:
🟢 Bullish Scenario: A strong weekly close above resistance, supported by increasing volume, could signal improving momentum.
🔴 Bearish Scenario: Losing the recent support area could expose TRB to further downside.
💡 MY TAKE:
TRB is at an interesting point on the weekly timeframe. But a compressed chart doesn't guarantee a breakout.
I'll be watching volume, support reactions, and weekly candle closes before making any major decision.
Patience is a strategy. Confirmation is everything.
What do you think about $TRB
🚀 Bullish breakout or another bearish move?
#TRB #Tellor #CryptoAnalysis #Binance #Altcoins
The weekly chart of Tellor ($TRB ) is telling an interesting story.
After a massive rally in 2024, TRB experienced a prolonged correction. But now, something interesting is happening — price action is becoming much tighter, and volatility appears to be cooling down.
🔍 WHAT THE WEEKLY CHART SHOWS:
1️⃣ Long-Term Downtrend: TRB has been making lower highs for a long time. The bigger trend has not fully reversed yet.
2️⃣ Important Support Zone: The $10–$12 area is worth watching as a potential support region.
3️⃣ First Resistance: The $20–$25 zone could become an important test for bullish momentum.
4️⃣ Bollinger Bands: Price is trading around the middle-to-lower portion of the weekly Bollinger Bands. A volatility expansion could bring a stronger move.
🎯 TWO POSSIBLE SCENARIOS:
🟢 Bullish Scenario: A strong weekly close above resistance, supported by increasing volume, could signal improving momentum.
🔴 Bearish Scenario: Losing the recent support area could expose TRB to further downside.
💡 MY TAKE:
TRB is at an interesting point on the weekly timeframe. But a compressed chart doesn't guarantee a breakout.
I'll be watching volume, support reactions, and weekly candle closes before making any major decision.
Patience is a strategy. Confirmation is everything.
What do you think about $TRB
🚀 Bullish breakout or another bearish move?
#TRB #Tellor #CryptoAnalysis #Binance #Altcoins