🚨 PEPE AT A CRITICAL LEVEL! Is This a Reversal Opportunity or Another Warning for Bulls?
PEPE is facing fresh selling pressure, and the latest chart is showing an interesting battle between buyers and sellers.
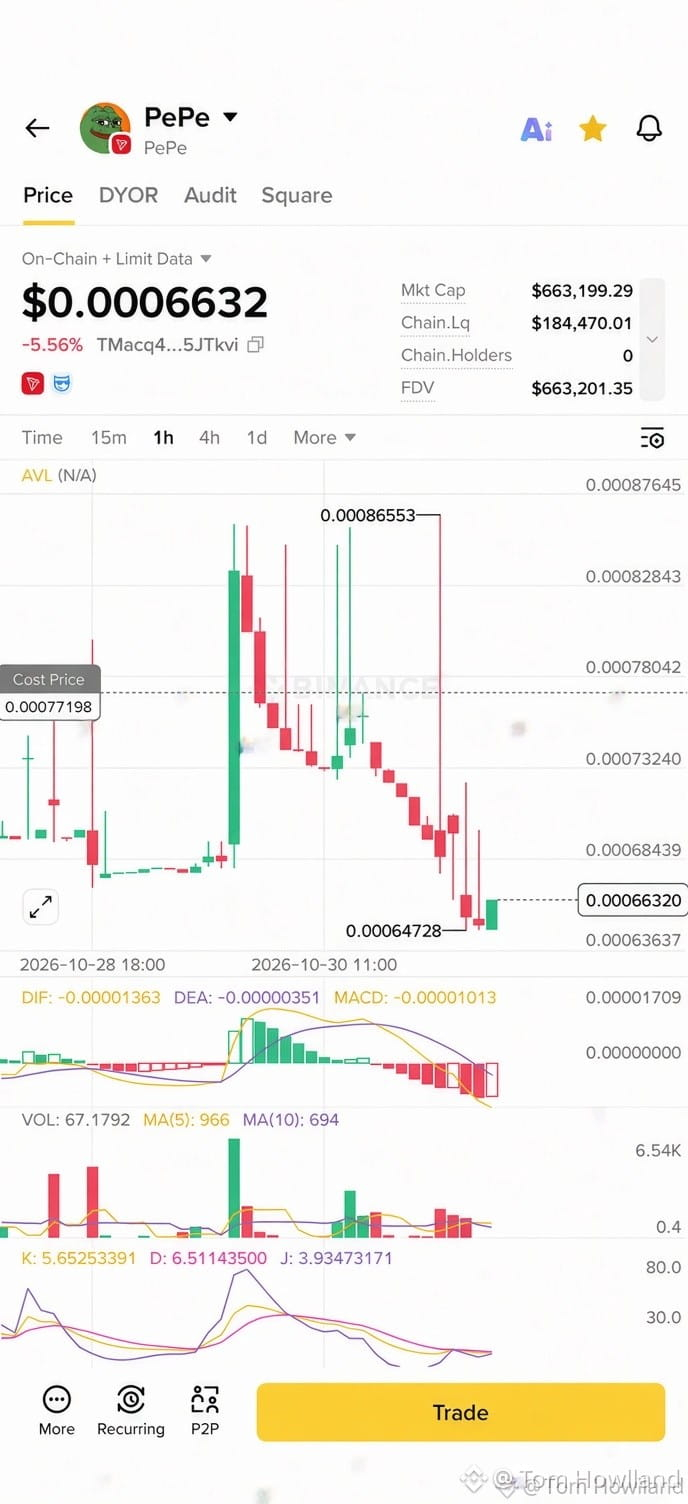
According to the 1-hour chart, PEPE is trading around $0.0006632, down approximately 5.56%. After a strong upward move toward $0.00086553, the price experienced a significant correction and recently tested the $0.00064728 area.
📉 What Does the Chart Tell Us?
• Price Action: Sellers currently have the advantage, with lower price movements following the recent rally.
• MACD: Negative readings suggest bearish momentum is still present.
• KDJ: The indicator is showing relatively low readings, which may attract attention from traders watching for a potential recovery.
Key Levels to Watch:
🔹 Support: $0.00064728
🔹 Resistance: Around $0.00073240
🔹 Major resistance: Around $0.00078042
A strong recovery above resistance could improve the short-term outlook. However, losing support could bring additional selling pressure.
My Take: PEPE is at an interesting technical moment. The next move needs confirmation from price action and trading volume. Smart traders should watch the levels rather than chase every candle.
🔥 What do you think: Is PEPE preparing for a comeback, or could bears push it lower?
$PEPE $USDT
#PepeCoin #CryptoTrading #TechnicalAnalysis #Memecoins #BinanceSquare
PEPE is facing fresh selling pressure, and the latest chart is showing an interesting battle between buyers and sellers.
According to the 1-hour chart, PEPE is trading around $0.0006632, down approximately 5.56%. After a strong upward move toward $0.00086553, the price experienced a significant correction and recently tested the $0.00064728 area.
📉 What Does the Chart Tell Us?
• Price Action: Sellers currently have the advantage, with lower price movements following the recent rally.
• MACD: Negative readings suggest bearish momentum is still present.
• KDJ: The indicator is showing relatively low readings, which may attract attention from traders watching for a potential recovery.
Key Levels to Watch:
🔹 Support: $0.00064728
🔹 Resistance: Around $0.00073240
🔹 Major resistance: Around $0.00078042
A strong recovery above resistance could improve the short-term outlook. However, losing support could bring additional selling pressure.
My Take: PEPE is at an interesting technical moment. The next move needs confirmation from price action and trading volume. Smart traders should watch the levels rather than chase every candle.
🔥 What do you think: Is PEPE preparing for a comeback, or could bears push it lower?
$PEPE $USDT
#PepeCoin #CryptoTrading #TechnicalAnalysis #Memecoins #BinanceSquare