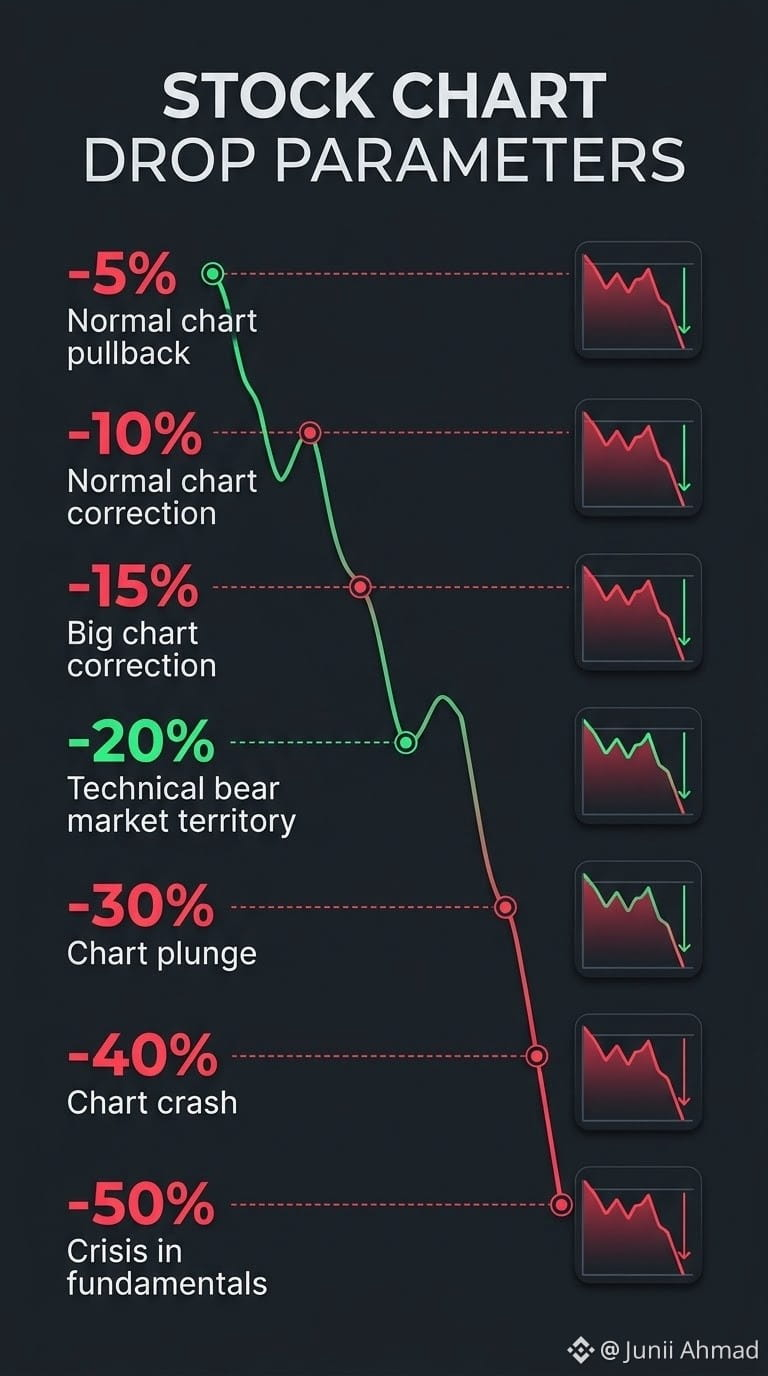
チャートパターンの下落パラメーター:
-5% = 通常のチャートの押し目
-10% = 通常のチャート調整
-15% = 大幅なチャート調整
-20% = テクニカル的な弱気相場の領域
-30% = チャートの急落
-40% = チャートの暴落
-50% = ファンダメンタルズの危機
#USMidtermElections #BinanceRestores28FiatWithdrawals #USOctoberNFP-AreRateCutsStillPossible #BinanceWithdrawalScamWarning #AppleEarningsAhead-CanStockHitNewHigh
-5% = 通常のチャートの押し目
-10% = 通常のチャート調整
-15% = 大幅なチャート調整
-20% = テクニカル的な弱気相場の領域
-30% = チャートの急落
-40% = チャートの暴落
-50% = ファンダメンタルズの危機
#USMidtermElections #BinanceRestores28FiatWithdrawals #USOctoberNFP-AreRateCutsStillPossible #BinanceWithdrawalScamWarning #AppleEarningsAhead-CanStockHitNewHigh