

Overview: BCHUSDT Perpetual Contract (4h Chart)
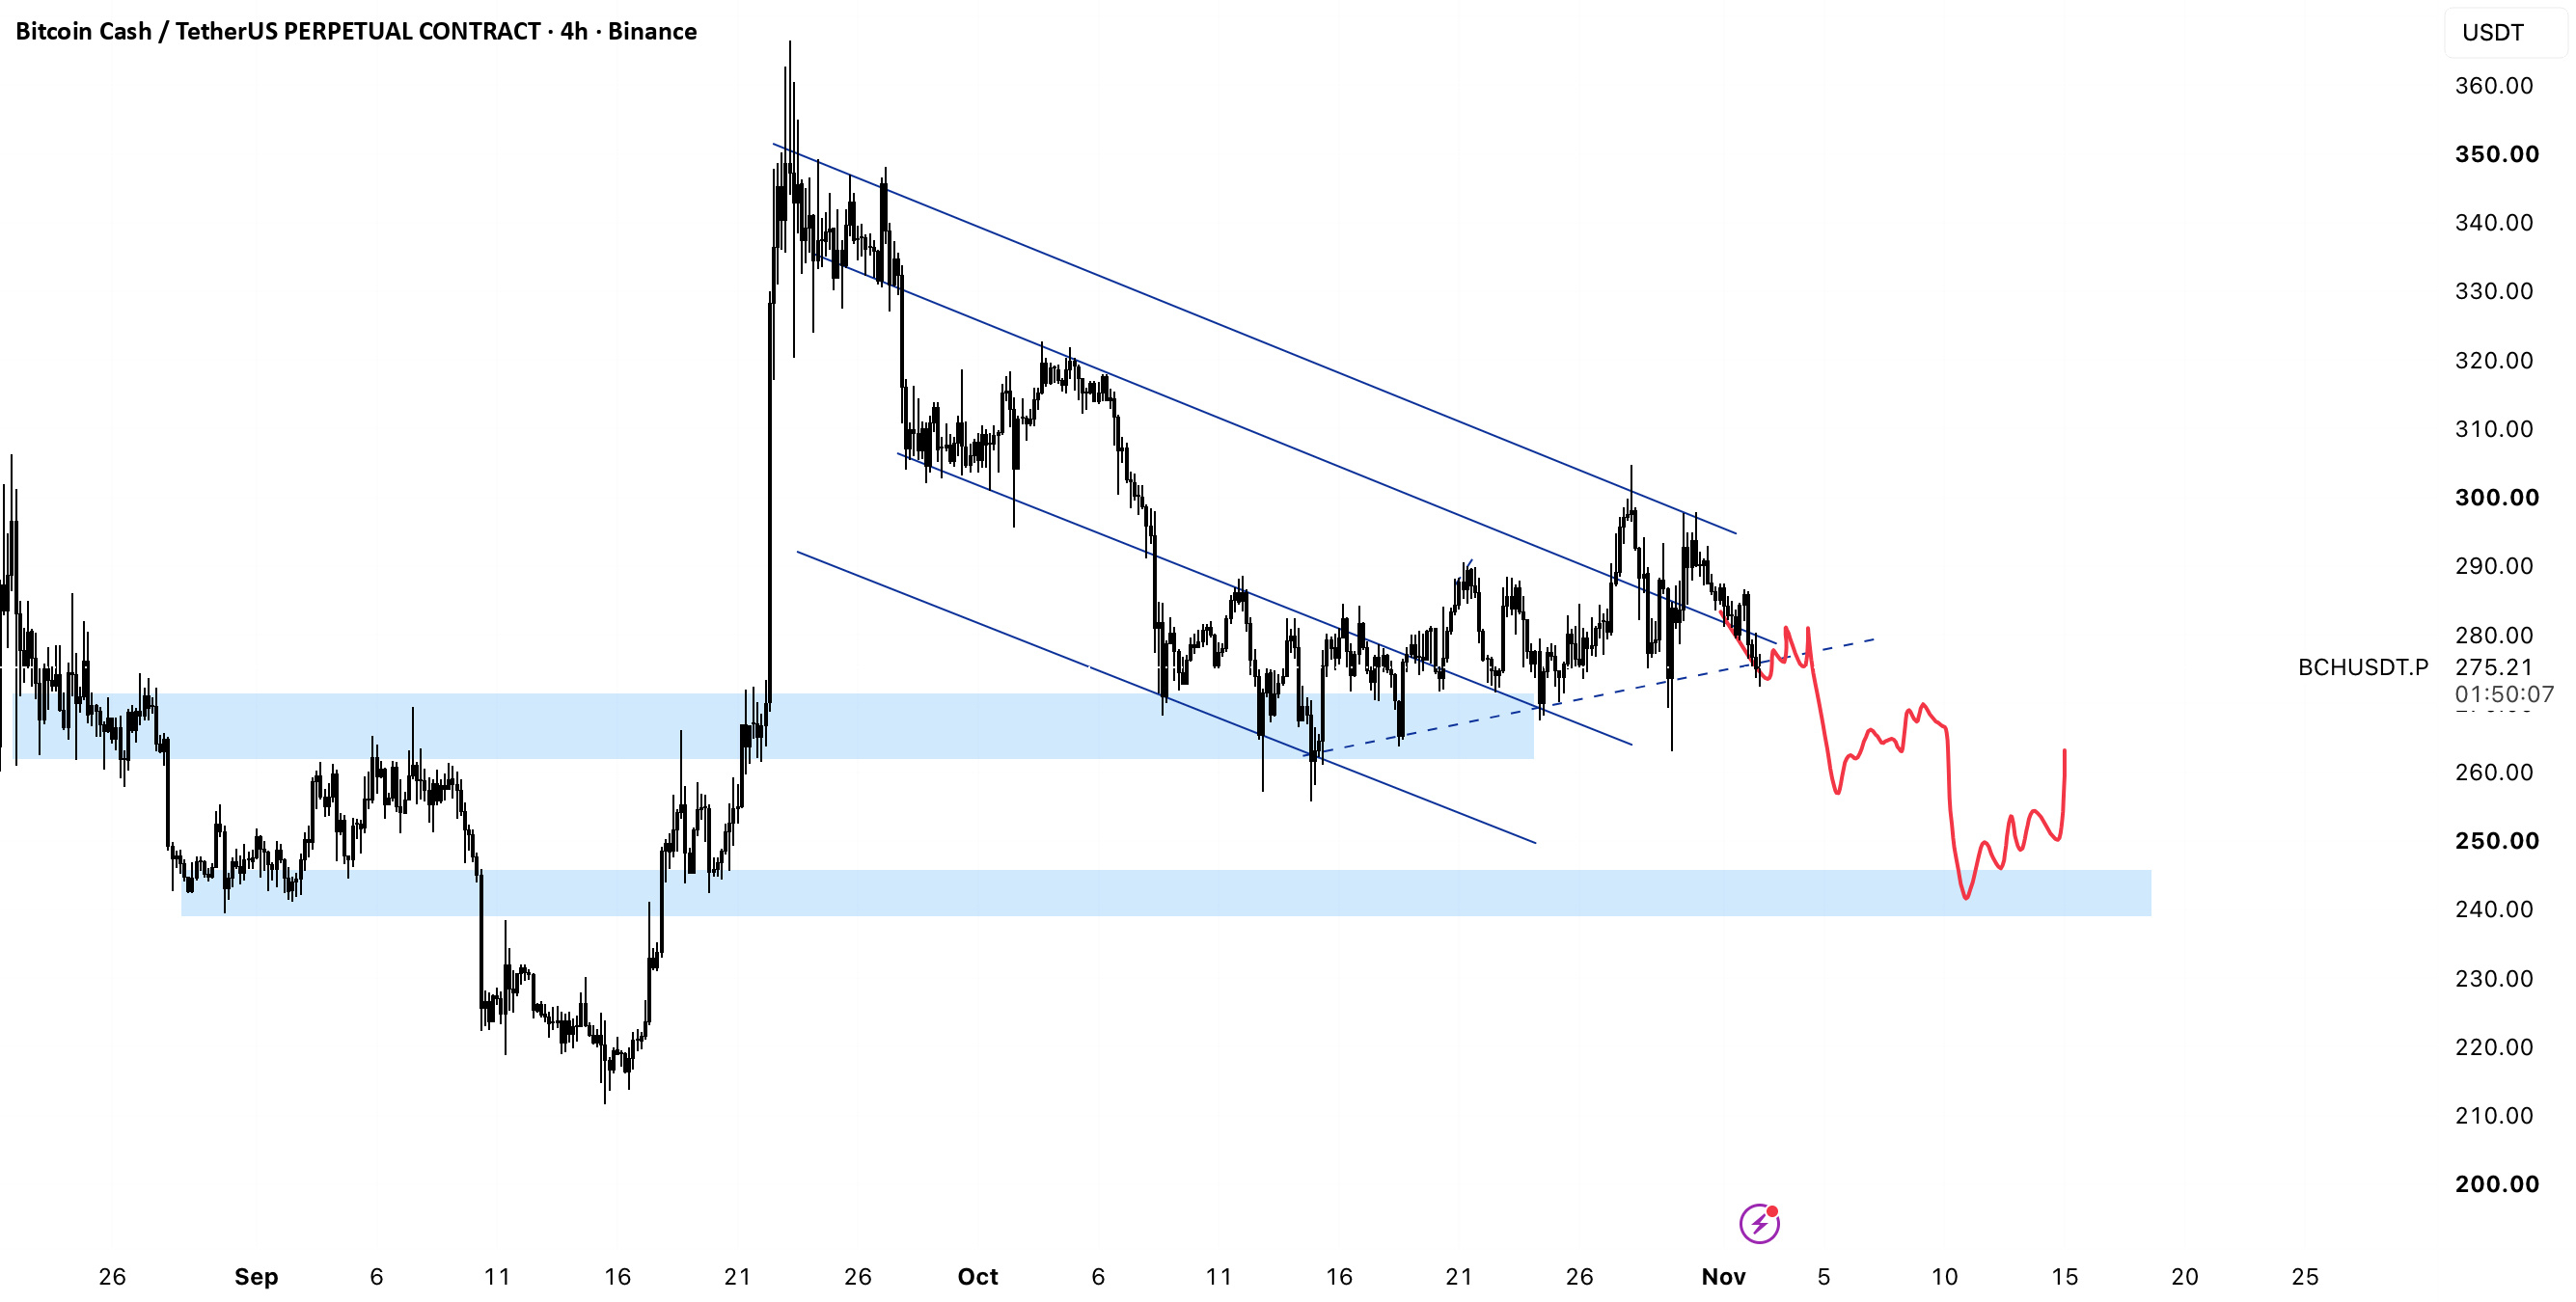
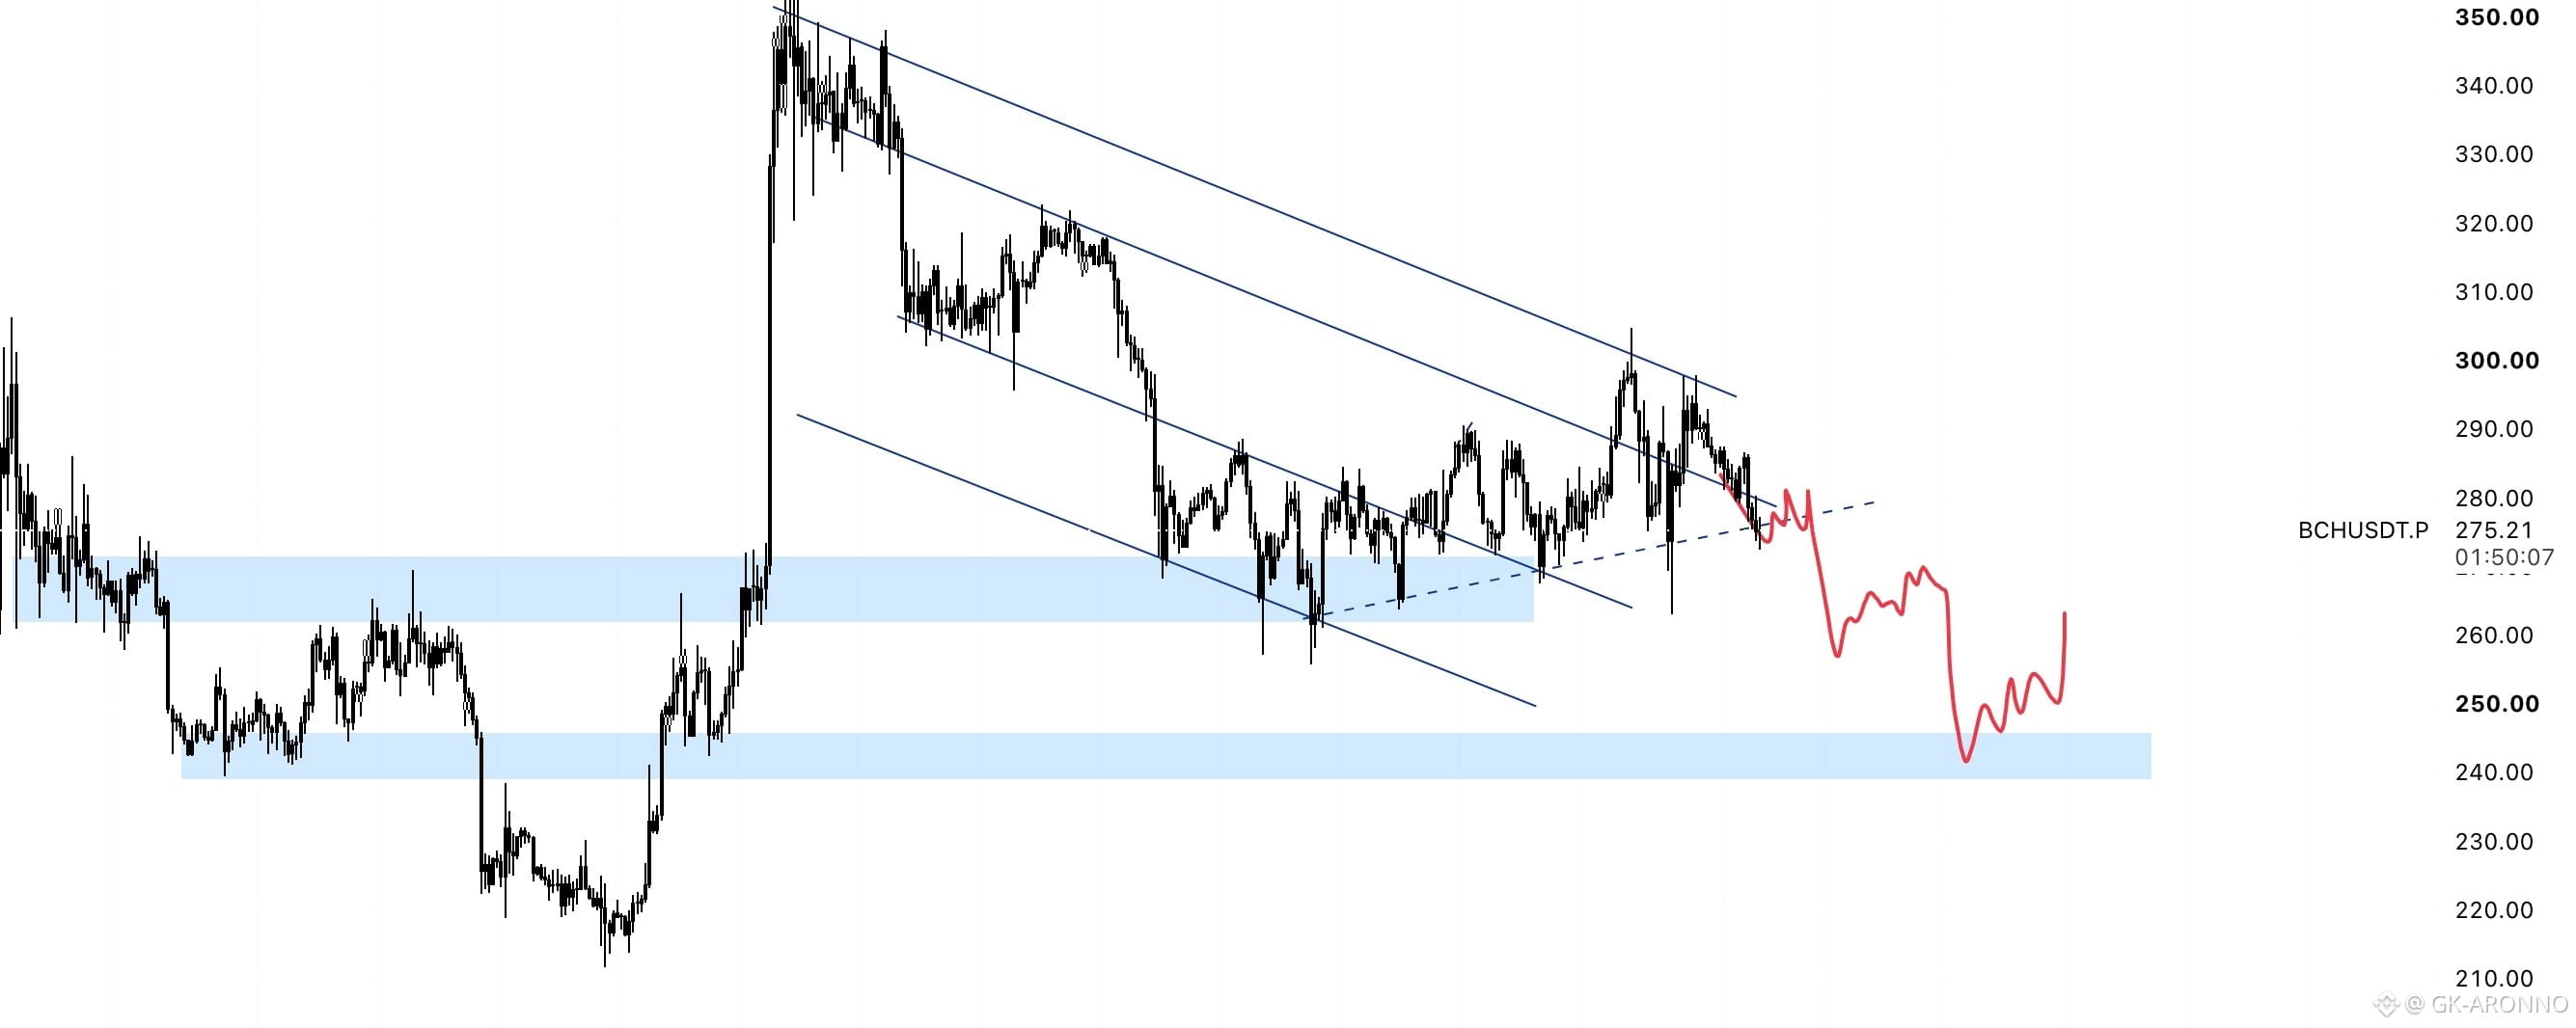
Bitcoin Cash (BCH) on the 4-hour timeframe is showing clear signs of weakness after breaking below local trendline support. Following a prolonged consolidation inside a descending channel and a minor breakdown through the $275 zone, price action is signaling a potential corrective leg downward.
Will buyers step in at the blue demand blocks, or will BCH sweep lower liquidity zones before recovery? Let's analyze the critical levels and probable price path.
Key Technical Levels to Watch
Immediate Resistance Zone: $278.00 – $282.00 (Broken trendline resistance and retest zone).
Upper Channel / Supply Zone: $295.00 – $300.00 (Major descending channel boundary).
First Support Zone (Demand Block 1): $260.00 – $268.00 (Intermediate horizontal support).
Major Support Zone (Demand Block 2): $240.00 – $248.00 (Key macro demand and consolidation low).
BCH Short-Term Trading Setup & Scenario
The Bearish Correction (Primary Outlook):
As indicated by the red projection line, BCH is currently undergoing a breakdown phase. A brief retest of the broken dotted trendline near $278 - $280 is expected before sellers force price lower toward Demand Zone 1 ($260 - $268). Should bearish momentum persist, expect a secondary wave driving price into the primary $240 - $248 demand pocket for a liquidity sweep and accumulation.
The Bullish Reversal Trigger:
To invalidate this short-term bearish outlook, BCH buyers must reclaim and close above $285 - $290 on the 4-hour candle with strong volume, shifting momentum back toward the top of the channel around $300+.
Disclaimer
This technical analysis is strictly for educational and informational purposes only and does not constitute financial or investment advice. Always manage your risk exposure, utilize appropriate stop-loss orders, and perform your own research before trading cryptocurrencies.