🚨 $ZEC TEETERING BETWEEN SUPPORT AND RESISTANCE – WILL IT REVERSE? 🦈
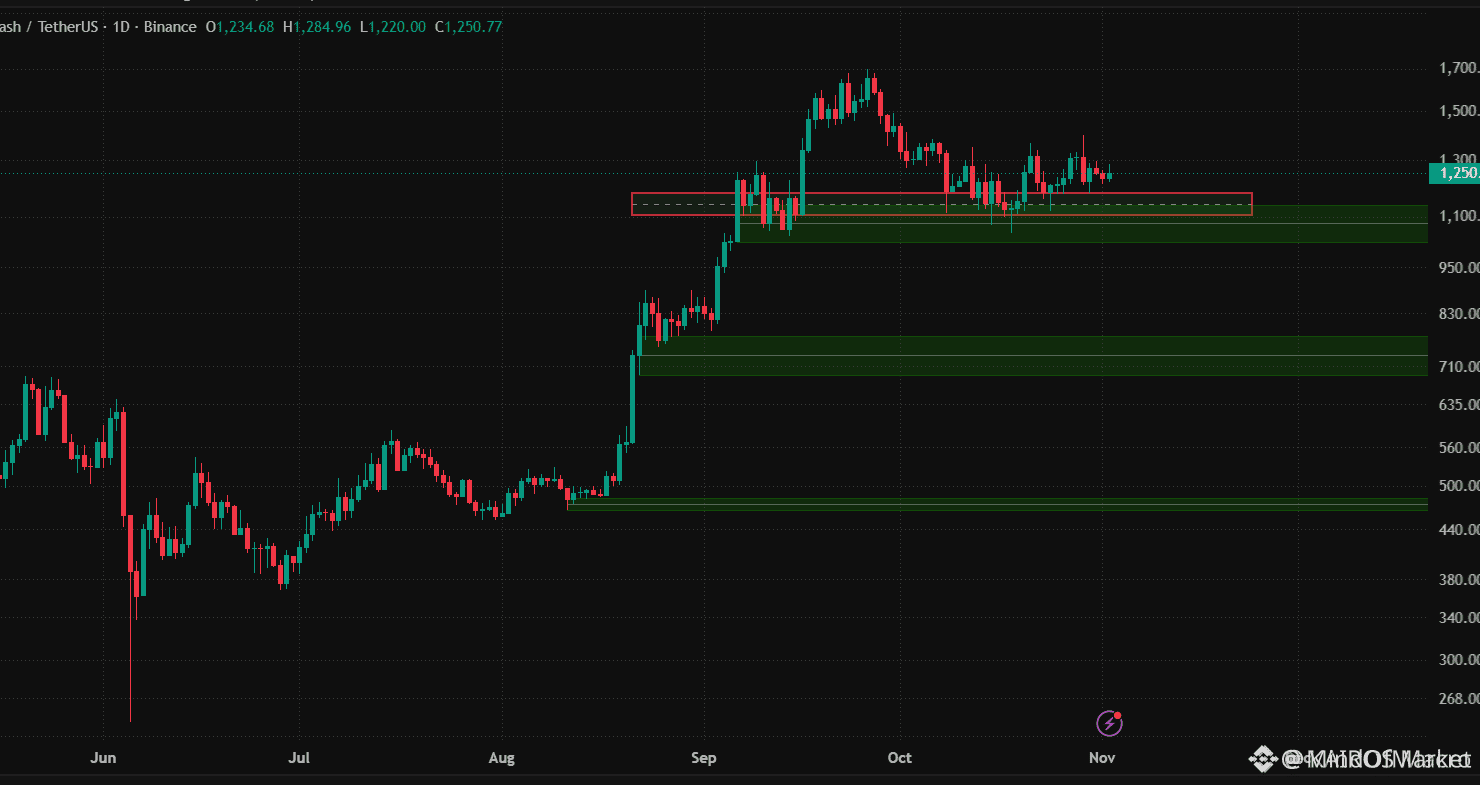
The $ZEC chart has carved a classic liquidity void, dropping from the 1,398 USD peak to a 1,180 USD trough before snapping back to 1,247 USD – a clear smart‑money sweep that left many accounts gasping. 📊 The 1,207‑1,220 USD band now acts as a fortified demand zone, absorbing sell pressure with each test.
Mid‑term bias remains bullish, but the price must clear the 1,260‑1,270 USD resistance cluster to flip the narrative. ⚡ A clean break would signal an institutional re‑entry, while a failure reinforces a short‑term range that tests trader nerves. 💡 How are you positioning for the next liquidity hunt? 💬
⚠️ Not financial advice. Always manage your risk. 🛡️
🏷️ #ZEC #LongSetup #Liquidity #Crypto
🔥 💎
The $ZEC chart has carved a classic liquidity void, dropping from the 1,398 USD peak to a 1,180 USD trough before snapping back to 1,247 USD – a clear smart‑money sweep that left many accounts gasping. 📊 The 1,207‑1,220 USD band now acts as a fortified demand zone, absorbing sell pressure with each test.
Mid‑term bias remains bullish, but the price must clear the 1,260‑1,270 USD resistance cluster to flip the narrative. ⚡ A clean break would signal an institutional re‑entry, while a failure reinforces a short‑term range that tests trader nerves. 💡 How are you positioning for the next liquidity hunt? 💬
⚠️ Not financial advice. Always manage your risk. 🛡️
🏷️ #ZEC #LongSetup #Liquidity #Crypto
🔥 💎