$ASTER | Daily Technical Outlook
Price: $0.7004 | RSI (14): 48
Structure
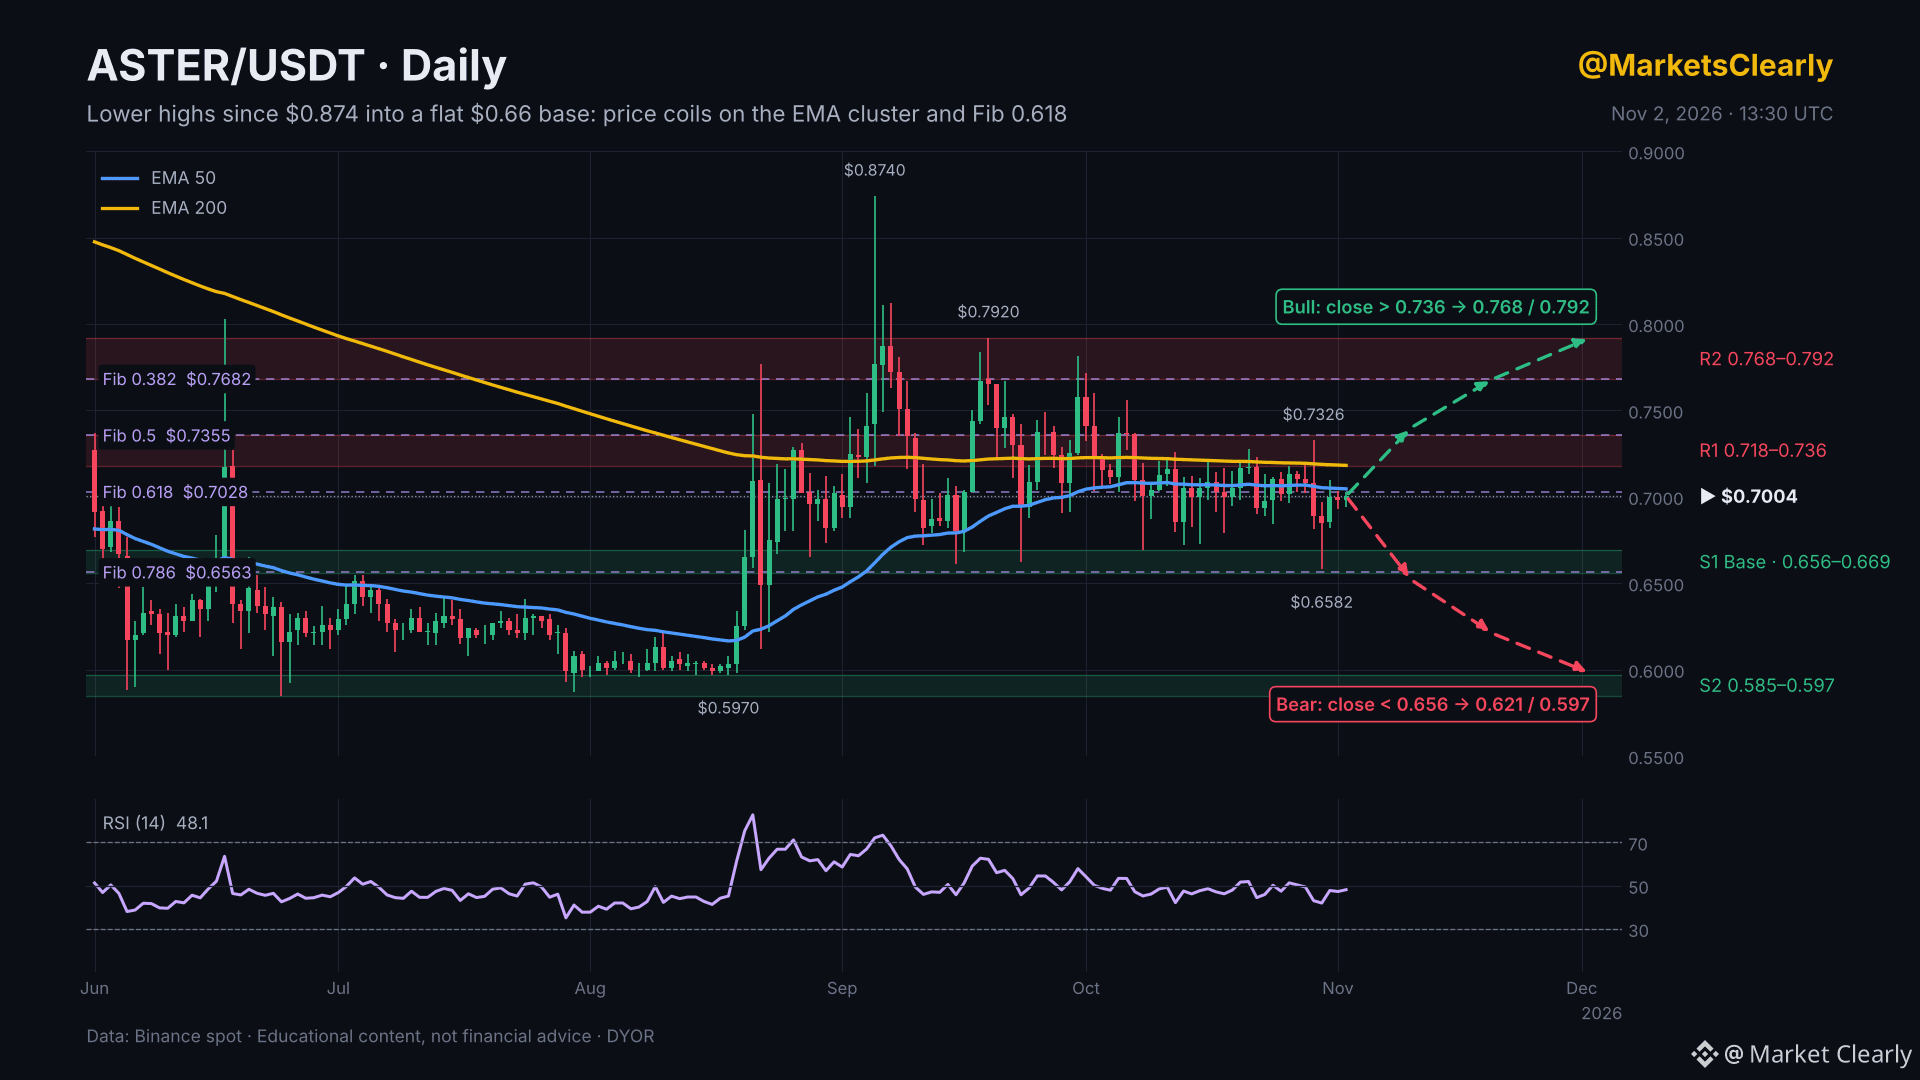
$ASTER has printed lower highs since the $0.874 September top: $0.792, $0.782, then $0.733. Lows have held flat at $0.658–0.669. The result is a descending triangle, with volume fading into the apex.
Key levels
Pivot: $0.700–0.705 (EMA 20/50 + Fib 0.618 of the $0.597–0.874 impulse). Price sits right on it.
Resistance: $0.718–0.736 (EMA 200, October highs, Fib 0.5), then $0.768–0.792.
Support: $0.656–0.669 (base tested four times + Fib 0.786), then $0.585–0.597.
Scenarios
Bullish: a daily close above $0.736 breaks the lower-high sequence and opens the way to $0.768, then $0.792.
Bearish: a daily close below $0.656 confirms the triangle breakdown and exposes $0.621, then $0.597.
View: RSI at 48 is neutral. Until one side of the $0.656–0.736 range breaks on a daily close, this is a range, not a trend.
Disclosure: I am a Binance Angel. $ASTER is a BNB Chain ecosystem token.
Not financial advice. DYOR.
#ASTER #TechnicalAnalysis #CryptoMarket
Price: $0.7004 | RSI (14): 48
Structure
$ASTER has printed lower highs since the $0.874 September top: $0.792, $0.782, then $0.733. Lows have held flat at $0.658–0.669. The result is a descending triangle, with volume fading into the apex.
Key levels
Pivot: $0.700–0.705 (EMA 20/50 + Fib 0.618 of the $0.597–0.874 impulse). Price sits right on it.
Resistance: $0.718–0.736 (EMA 200, October highs, Fib 0.5), then $0.768–0.792.
Support: $0.656–0.669 (base tested four times + Fib 0.786), then $0.585–0.597.
Scenarios
Bullish: a daily close above $0.736 breaks the lower-high sequence and opens the way to $0.768, then $0.792.
Bearish: a daily close below $0.656 confirms the triangle breakdown and exposes $0.621, then $0.597.
View: RSI at 48 is neutral. Until one side of the $0.656–0.736 range breaks on a daily close, this is a range, not a trend.
Disclosure: I am a Binance Angel. $ASTER is a BNB Chain ecosystem token.
Not financial advice. DYOR.
#ASTER #TechnicalAnalysis #CryptoMarket