HYPE Cools Off Near $86.50: Healthy Pullback After a Big Rally or the Start of a Deeper Fade?
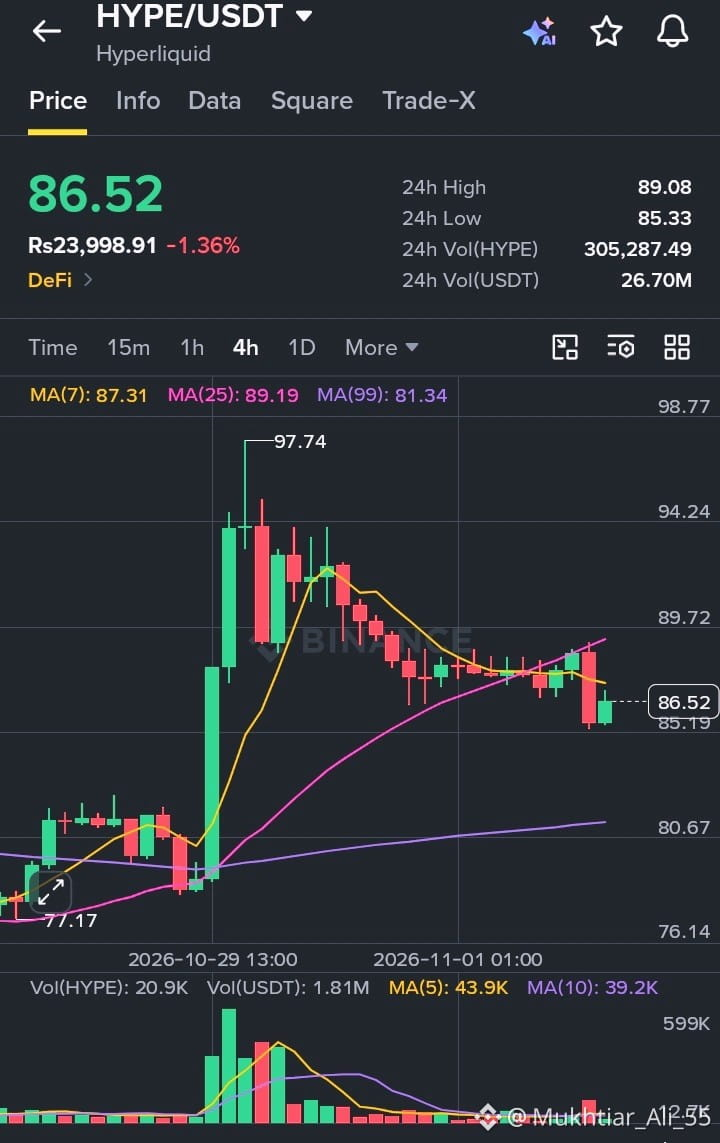
Hyperliquid is trading at $86.52 on the 4H chart, down 1.36% on the day. After the explosive breakout that carried price to $97.74, HYPE has been giving back gains steadily and is now testing the area around the moving averages. This chart looks very different from the rest of the majors I’ve been tracking, since HYPE is correcting from a rally rather than bouncing from a sell-off.
Price structure: The 24h range sits between $85.33 and $89.08. Since the $97.74 peak, the market has printed a sequence of lower highs, and the latest red candle pushed price back toward the bottom of the range. The bounce attempts have been small and short-lived, which tells me sellers are still setting the pace for now.
Moving averages: Price has slipped below the MA(7) at 87.31 and the MA(25) at 89.19, and both are now rolling over. The MA(99) at 81.34 is still sloping upward well below price, which is the one constructive detail here. It means the larger trend remains intact even though the short-term momentum has weakened.
Volume: 24h volume is about 305,287 HYPE (roughly $26.70M). Volume peaked during the breakout and has faded steadily through the pullback. That fits a cooling market rather than panic selling, though the latest red candle did show a small uptick in activity that is worth monitoring.
What I’m watching:
Support: $85.33, followed by the MA(99) zone near $81.34 and the $77.17 base
Resistance: $87.31 to $89.19, where the MA(7) and MA(25) sit, then the $89.08 daily high and the $97.74 peak
A clean 4H close back above $89.20 with rising volume would be the first sign that buyers are regaining control. A break below $85.33 would open the door to a deeper retest of the MA(99) near $81.
#Hyperliquid #HYPE #CryptoTrading #TechnicalAnalysis #HYPEUSDT
$HYPE
Hyperliquid is trading at $86.52 on the 4H chart, down 1.36% on the day. After the explosive breakout that carried price to $97.74, HYPE has been giving back gains steadily and is now testing the area around the moving averages. This chart looks very different from the rest of the majors I’ve been tracking, since HYPE is correcting from a rally rather than bouncing from a sell-off.
Price structure: The 24h range sits between $85.33 and $89.08. Since the $97.74 peak, the market has printed a sequence of lower highs, and the latest red candle pushed price back toward the bottom of the range. The bounce attempts have been small and short-lived, which tells me sellers are still setting the pace for now.
Moving averages: Price has slipped below the MA(7) at 87.31 and the MA(25) at 89.19, and both are now rolling over. The MA(99) at 81.34 is still sloping upward well below price, which is the one constructive detail here. It means the larger trend remains intact even though the short-term momentum has weakened.
Volume: 24h volume is about 305,287 HYPE (roughly $26.70M). Volume peaked during the breakout and has faded steadily through the pullback. That fits a cooling market rather than panic selling, though the latest red candle did show a small uptick in activity that is worth monitoring.
What I’m watching:
Support: $85.33, followed by the MA(99) zone near $81.34 and the $77.17 base
Resistance: $87.31 to $89.19, where the MA(7) and MA(25) sit, then the $89.08 daily high and the $97.74 peak
A clean 4H close back above $89.20 with rising volume would be the first sign that buyers are regaining control. A break below $85.33 would open the door to a deeper retest of the MA(99) near $81.
#Hyperliquid #HYPE #CryptoTrading #TechnicalAnalysis #HYPEUSDT
$HYPE