ZRX/USDT 1h: the recovery is meeting another test.
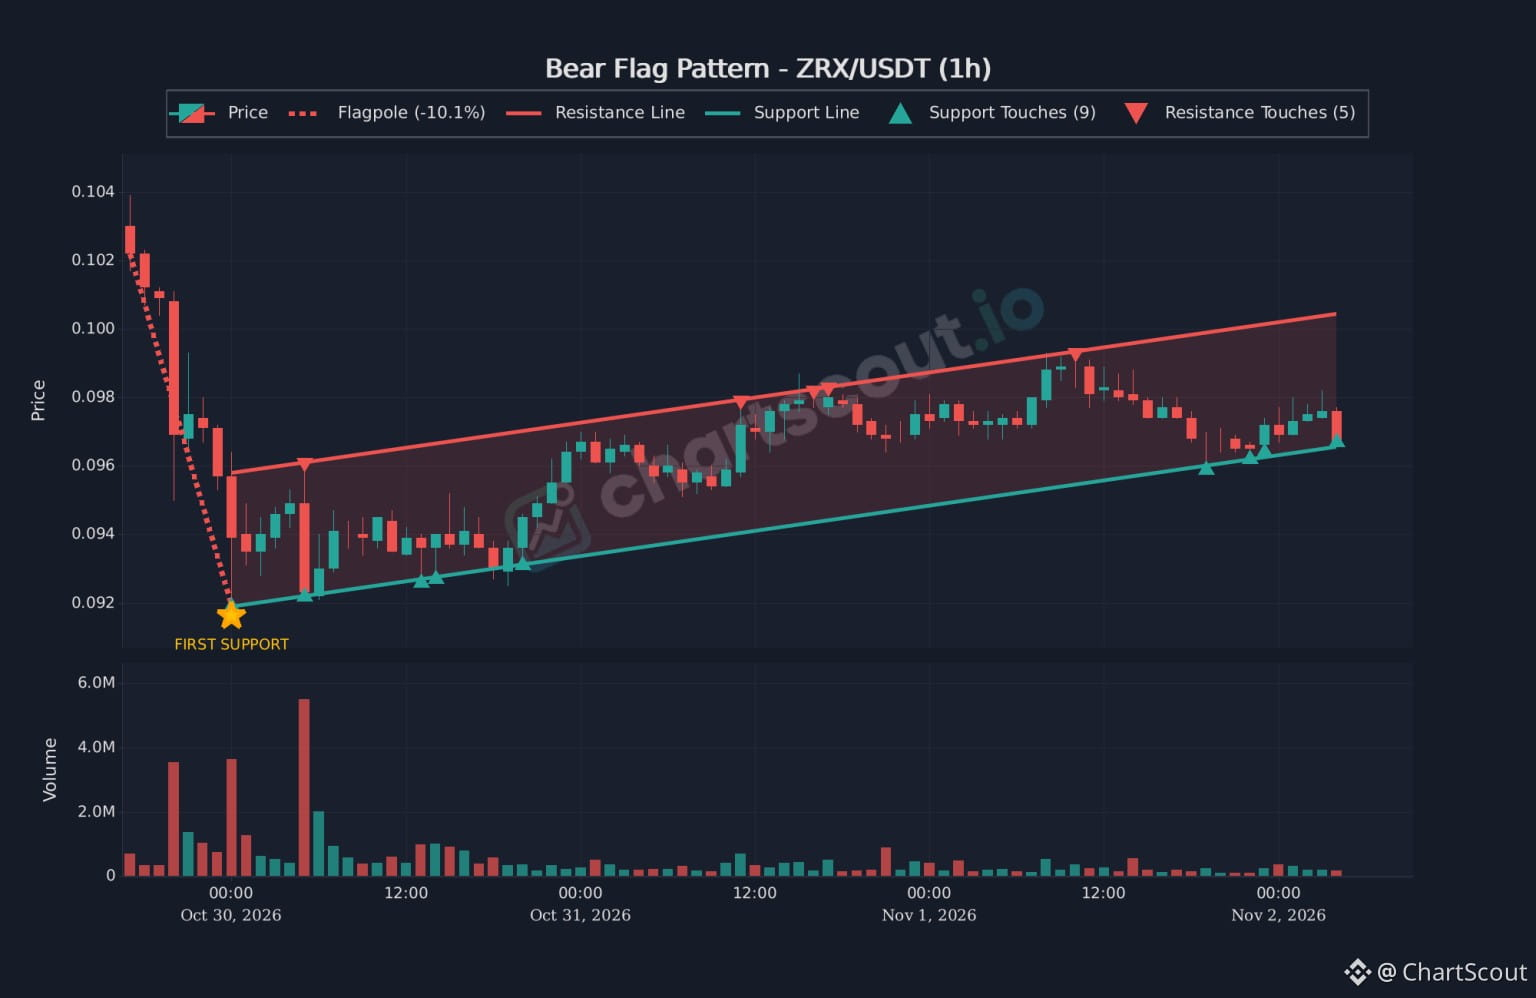
Following a sharp decline, price has worked higher inside a rising channel. The chart labels a potential bear flag, but the lower boundary is still holding in this snapshot.
Levels shown:
• Lower channel boundary: approximately 0.0965
• Upper channel boundary: approximately 0.1004
The interesting part is what happens at support not the pattern name alone.
Would you read this as a recovery channel or a possible continuation setup?
Chart: ChartScout.
#ZRX #ZRXUSDT🏆 #TechnicalAnalysis #ZRX/USDT
Following a sharp decline, price has worked higher inside a rising channel. The chart labels a potential bear flag, but the lower boundary is still holding in this snapshot.
Levels shown:
• Lower channel boundary: approximately 0.0965
• Upper channel boundary: approximately 0.1004
The interesting part is what happens at support not the pattern name alone.
Would you read this as a recovery channel or a possible continuation setup?
Chart: ChartScout.
#ZRX #ZRXUSDT🏆 #TechnicalAnalysis #ZRX/USDT