📊 Crypto Market Overview | November 2, 2026
Bitcoin Price Action & Market Sentiment
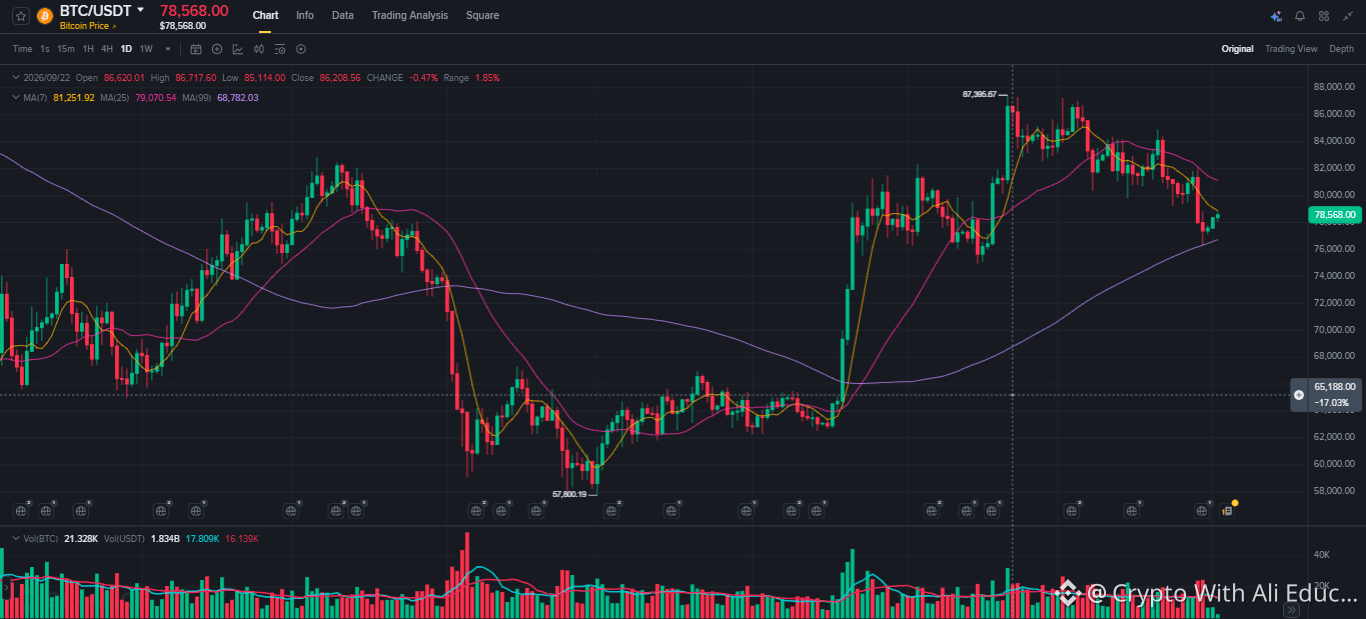
Bitcoin is experiencing a pullback after its recent recovery. The attached chart shows short-term selling pressure, while price remains above the longer-term moving average. The market is assessing whether recent support can hold.
🟠 Bitcoin (BTC) — Chart Analysis
💰 Current chart price: Approximately $78,568
📉 Price Action
BTC rallied from the $60K–$65K region toward the $85K–$87K area before pulling back.
Recent candles show weakening short-term momentum, with price moving below the shorter-term moving averages.
BTC remains above the longer-term moving average visible on the chart, which may provide an important reference for the broader structure.
Support to watch: $76K–$78K, followed by the $73K–$75K region.
Resistance to watch: $80K–$83K, with the previous swing-high region near $85K–$87K.
📊 Volume & Sentiment
Recent selling has occurred alongside fluctuating volume. The chart does not yet establish whether buyers will regain control or selling pressure will continue.
Overall sentiment: Neutral to Cautious.
Bitcoin's short-term structure has weakened, but the longer-term chart context remains important. A clearer directional assessment requires observing how price behaves around support and resistance.
💬 Community Question: Is BTC preparing to consolidate, or could selling pressure continue?
Educational content only. Not financial advice.
#bitcoin #CryptoMarket #CryptoAnalysis #MarketSentiment #trading
Bitcoin Price Action & Market Sentiment
Bitcoin is experiencing a pullback after its recent recovery. The attached chart shows short-term selling pressure, while price remains above the longer-term moving average. The market is assessing whether recent support can hold.
🟠 Bitcoin (BTC) — Chart Analysis
💰 Current chart price: Approximately $78,568
📉 Price Action
BTC rallied from the $60K–$65K region toward the $85K–$87K area before pulling back.
Recent candles show weakening short-term momentum, with price moving below the shorter-term moving averages.
BTC remains above the longer-term moving average visible on the chart, which may provide an important reference for the broader structure.
Support to watch: $76K–$78K, followed by the $73K–$75K region.
Resistance to watch: $80K–$83K, with the previous swing-high region near $85K–$87K.
📊 Volume & Sentiment
Recent selling has occurred alongside fluctuating volume. The chart does not yet establish whether buyers will regain control or selling pressure will continue.
Overall sentiment: Neutral to Cautious.
Bitcoin's short-term structure has weakened, but the longer-term chart context remains important. A clearer directional assessment requires observing how price behaves around support and resistance.
💬 Community Question: Is BTC preparing to consolidate, or could selling pressure continue?
Educational content only. Not financial advice.
#bitcoin #CryptoMarket #CryptoAnalysis #MarketSentiment #trading