🚨 LSK Price Alert: Massive Pump, Sharp Rejection! Is Another Move Coming?
Lisk ($LSK ) is showing extreme volatility, and the 4H chart is sending an important signal.
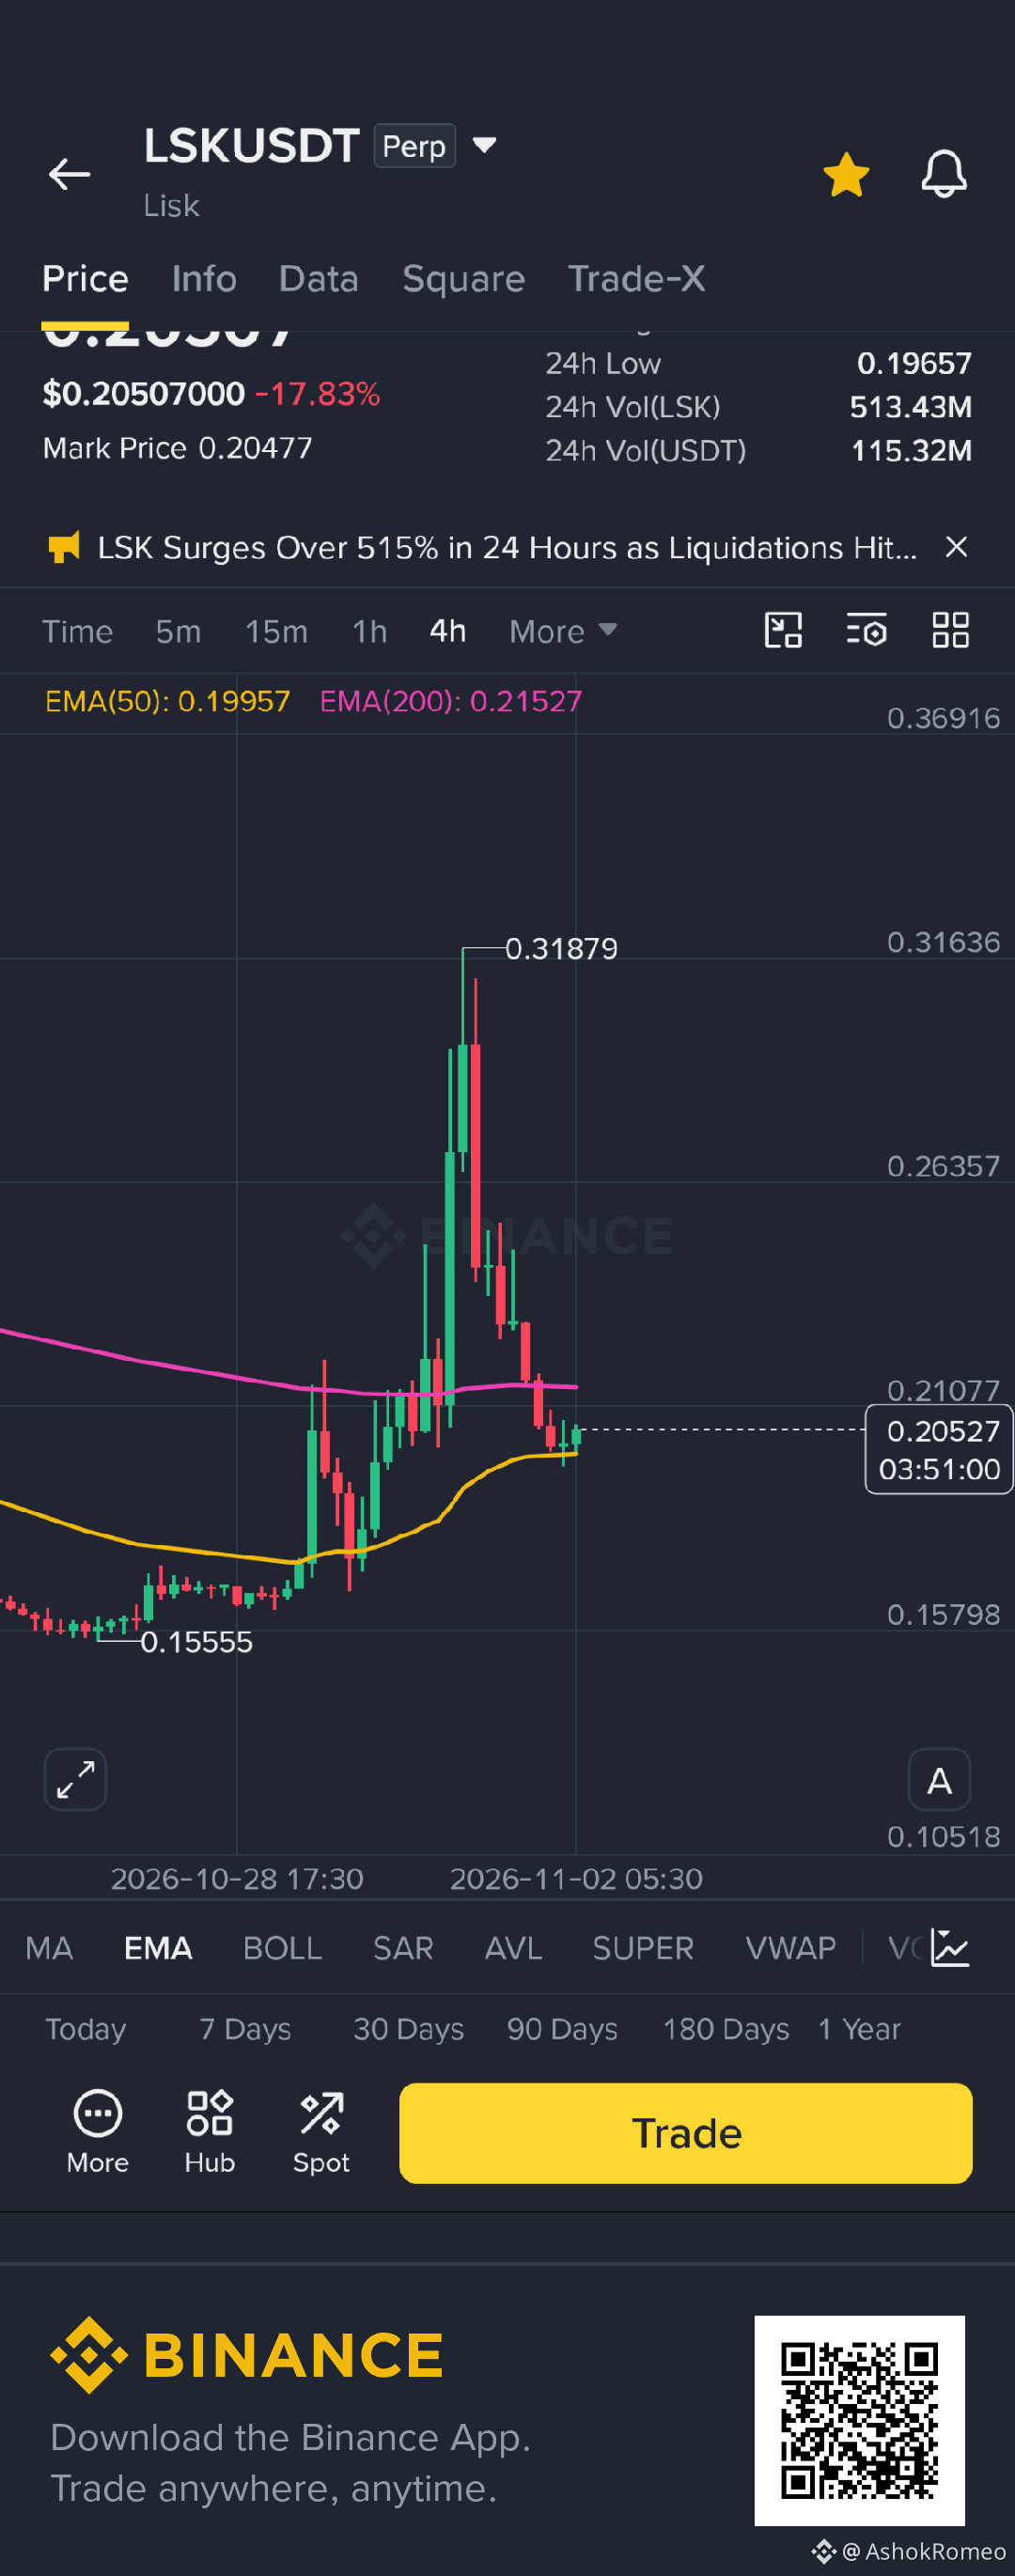
After a powerful rally, LSK reached a high of $0.31879 before facing strong selling pressure.
Now the real question is: Are buyers preparing for another breakout, or is the market entering a deeper correction?
📊 4H Technical Analysis
Current chart price: $0.20515
Key indicators:
- EMA 50: $0.19956
- EMA 200: $0.21527
- Recent swing high: $0.31879
- Recent low: $0.19657
🔍 Important Price Levels
🟢 Support Zone
- $0.1995 – EMA 50 support
- $0.1965 – Recent swing low
- $0.1800 – Potential downside level if support breaks
🔴 Resistance Zone
- $0.2107 – Immediate resistance
- $0.2152 – EMA 200 resistance
- $0.2300 – Next recovery level
- $0.2635 – Major upside resistance
🐂 Bullish Scenario
If LSK holds above $0.1965 and buyers reclaim the $0.2152 EMA 200 level with strong volume, a recovery toward $0.2300 and potentially $0.2635 could develop.
🐻 Bearish Scenario
If LSK loses $0.1965 with a strong 4H candle close below support, selling pressure could increase.
The next potential downside area to monitor is $0.1800.
🧠 My Market View
I am not chasing this pump.
After such an aggressive move, protecting capital is more important than FOMO buying.
I want to see:
1. Strong buying volume.
2. A confirmed support hold.
3. A 4H close above EMA 200.
4. A successful retest before considering bullish continuation.
The next major move will depend on whether buyers can reclaim control.
💬 What Do You Think?
Will LSK reclaim $0.215 and move toward $0.263?
Or will bears push the price below $0.196?
Share your analysis in the comments! 👇
#LSK #Lisk #CryptoAnalysis #BinanceSquare #Altcoins #TechnicalAnalysis #CryptoTrading #Bitcoin
⚠️ Disclaimer: This is technical analysis for educational purposes only, not financial advice. Futures trading carries significant risk. Always use proper risk management and DYOR.
$LSK
Lisk ($LSK ) is showing extreme volatility, and the 4H chart is sending an important signal.
After a powerful rally, LSK reached a high of $0.31879 before facing strong selling pressure.
Now the real question is: Are buyers preparing for another breakout, or is the market entering a deeper correction?
📊 4H Technical Analysis
Current chart price: $0.20515
Key indicators:
- EMA 50: $0.19956
- EMA 200: $0.21527
- Recent swing high: $0.31879
- Recent low: $0.19657
🔍 Important Price Levels
🟢 Support Zone
- $0.1995 – EMA 50 support
- $0.1965 – Recent swing low
- $0.1800 – Potential downside level if support breaks
🔴 Resistance Zone
- $0.2107 – Immediate resistance
- $0.2152 – EMA 200 resistance
- $0.2300 – Next recovery level
- $0.2635 – Major upside resistance
🐂 Bullish Scenario
If LSK holds above $0.1965 and buyers reclaim the $0.2152 EMA 200 level with strong volume, a recovery toward $0.2300 and potentially $0.2635 could develop.
🐻 Bearish Scenario
If LSK loses $0.1965 with a strong 4H candle close below support, selling pressure could increase.
The next potential downside area to monitor is $0.1800.
🧠 My Market View
I am not chasing this pump.
After such an aggressive move, protecting capital is more important than FOMO buying.
I want to see:
1. Strong buying volume.
2. A confirmed support hold.
3. A 4H close above EMA 200.
4. A successful retest before considering bullish continuation.
The next major move will depend on whether buyers can reclaim control.
💬 What Do You Think?
Will LSK reclaim $0.215 and move toward $0.263?
Or will bears push the price below $0.196?
Share your analysis in the comments! 👇
#LSK #Lisk #CryptoAnalysis #BinanceSquare #Altcoins #TechnicalAnalysis #CryptoTrading #Bitcoin
⚠️ Disclaimer: This is technical analysis for educational purposes only, not financial advice. Futures trading carries significant risk. Always use proper risk management and DYOR.
$LSK