
$AAVE BULLISH BREAKOUT WATCH 🚀
BULLISH MOMENTUM
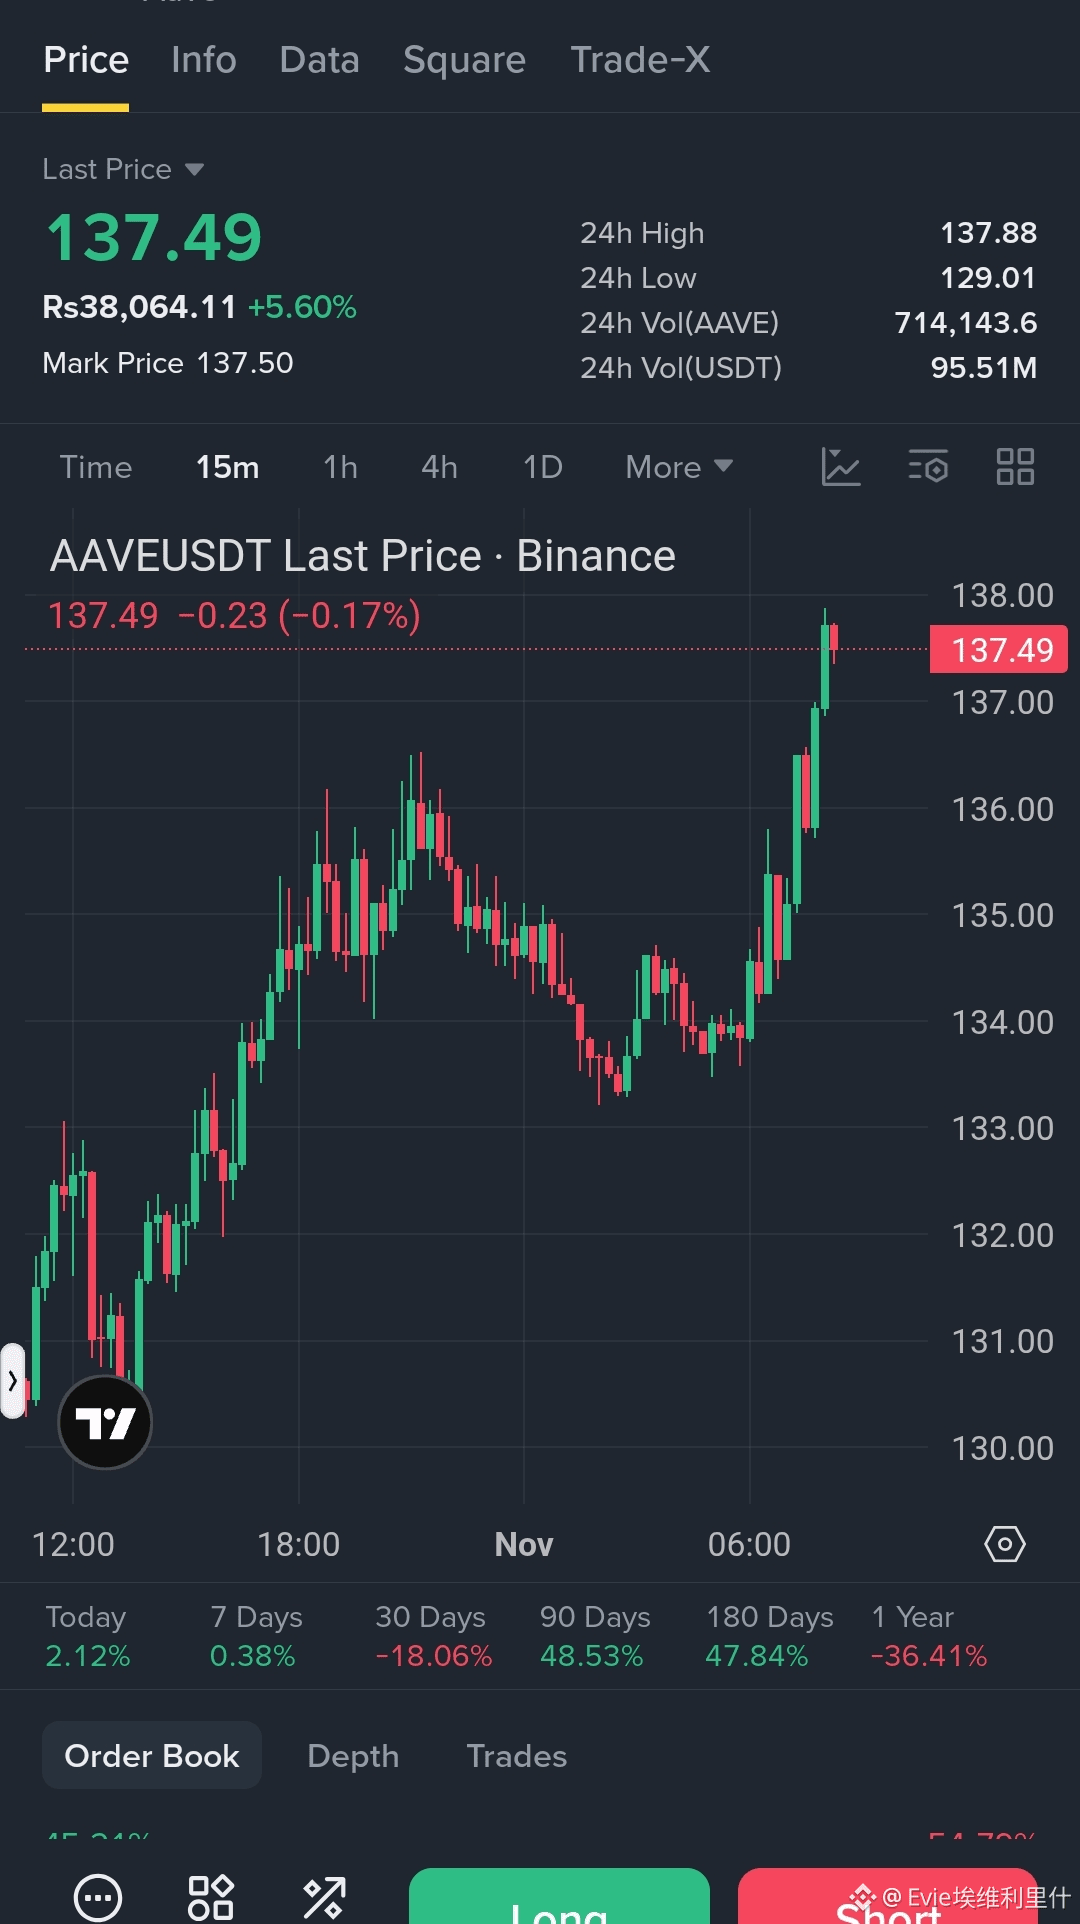
Current Price: $137.49 24H High: $137.88 24H Low: $129.01 24H Turnover: $95.51M
Entry Zone: $136.00–$137.50 TP1: $139.00 TP2: $140.00 TP3: $142.00 Stop Loss: $133.50
Technical Analysis:
AAVE is showing strong bullish momentum after recovering from the $129.01 support zone. The 15-minute chart displays a multi-wave upward move followed by a sharp breakout toward $137.88.
Buyers are currently testing an important resistance area. However, the slight negative momentum in the active candle suggests some profit-booking near the session high.
Key Levels to Watch:
Major Resistance: $137.88
Breakout Target: $139–$142
Next Upside Target: $145
Immediate Support: $135.00
Major Support: $132.00–$129.01
Bullish Scenario: A confirmed 15m close above $137.88 with strong volume could open the way toward $139 and $142.
Bearish Scenario: Rejection near $137.88 could trigger a pullback toward $135. Losing this level may expose $132.
Market Outlook: AAVE is up 5.60% in 24 hours and 48.53% over 90 days. Short-term momentum is strong, but the 30-day performance remains negative at 18.06%.
BREAKOUT IS NEAR! CAN AAVE CONQUER $138? WATCH THE CONFIRMATION.
Avoid chasing a vertical candle. Wait for a confirmed breakout or a healthy retest.
$ZEC
$AAPLB
BULLISH MOMENTUM
Current Price: $137.49 24H High: $137.88 24H Low: $129.01 24H Turnover: $95.51M
Entry Zone: $136.00–$137.50 TP1: $139.00 TP2: $140.00 TP3: $142.00 Stop Loss: $133.50
Technical Analysis:
AAVE is showing strong bullish momentum after recovering from the $129.01 support zone. The 15-minute chart displays a multi-wave upward move followed by a sharp breakout toward $137.88.
Buyers are currently testing an important resistance area. However, the slight negative momentum in the active candle suggests some profit-booking near the session high.
Key Levels to Watch:
Major Resistance: $137.88
Breakout Target: $139–$142
Next Upside Target: $145
Immediate Support: $135.00
Major Support: $132.00–$129.01
Bullish Scenario: A confirmed 15m close above $137.88 with strong volume could open the way toward $139 and $142.
Bearish Scenario: Rejection near $137.88 could trigger a pullback toward $135. Losing this level may expose $132.
Market Outlook: AAVE is up 5.60% in 24 hours and 48.53% over 90 days. Short-term momentum is strong, but the 30-day performance remains negative at 18.06%.
BREAKOUT IS NEAR! CAN AAVE CONQUER $138? WATCH THE CONFIRMATION.
Avoid chasing a vertical candle. Wait for a confirmed breakout or a healthy retest.
$ZEC
$AAPLB