Ethereum: Is the bearish trend still in control?
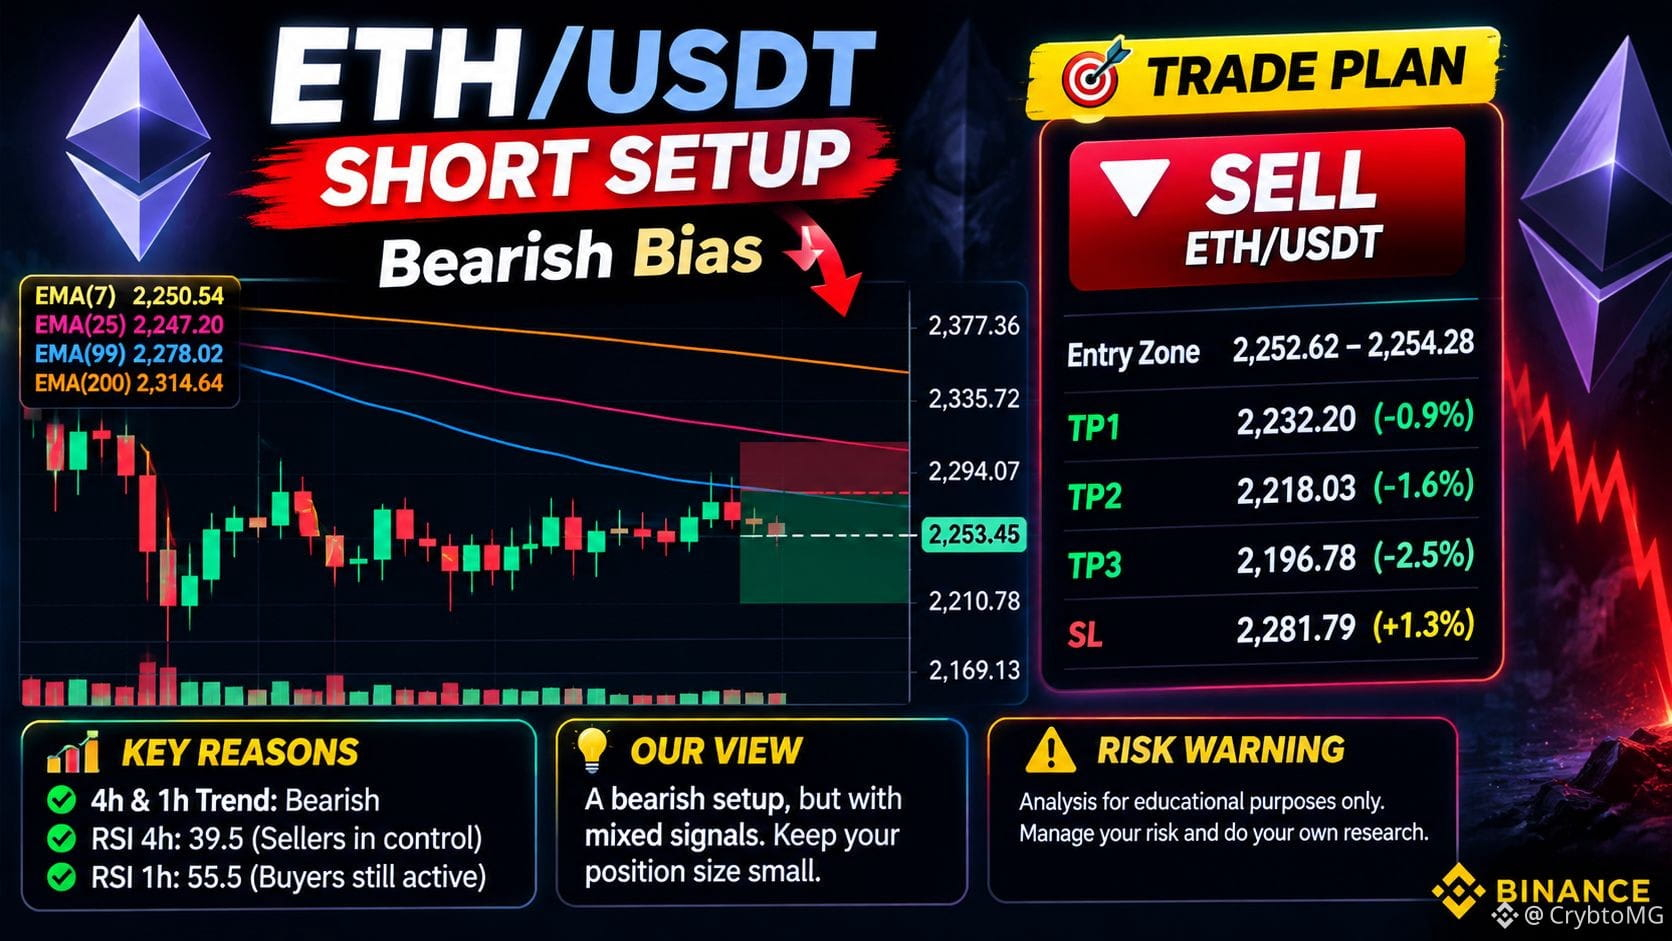
$ETH is showing mixed signals across different timeframes.
Here is what the technical picture suggests:
🔴 4-hour chart
Price is below the EMA 50 and EMA 200.
RSI is around 39.5, suggesting sellers have the advantage.
🟢 1-hour chart
Price is also below the EMA 50 and EMA 200.
RSI is around 55.5, showing that buyers are still trying to push back.
What does this mean?
The higher timeframe currently looks bearish, but the shorter timeframe shows some buying pressure.
This creates uncertainty. A bearish trend does not guarantee that the price will continue falling.
The key is to watch whether sellers maintain control or buyers manage to regain momentum.
What would make you reconsider your view on ETH?
#Ethereum #ETH #CryptoAnalysis