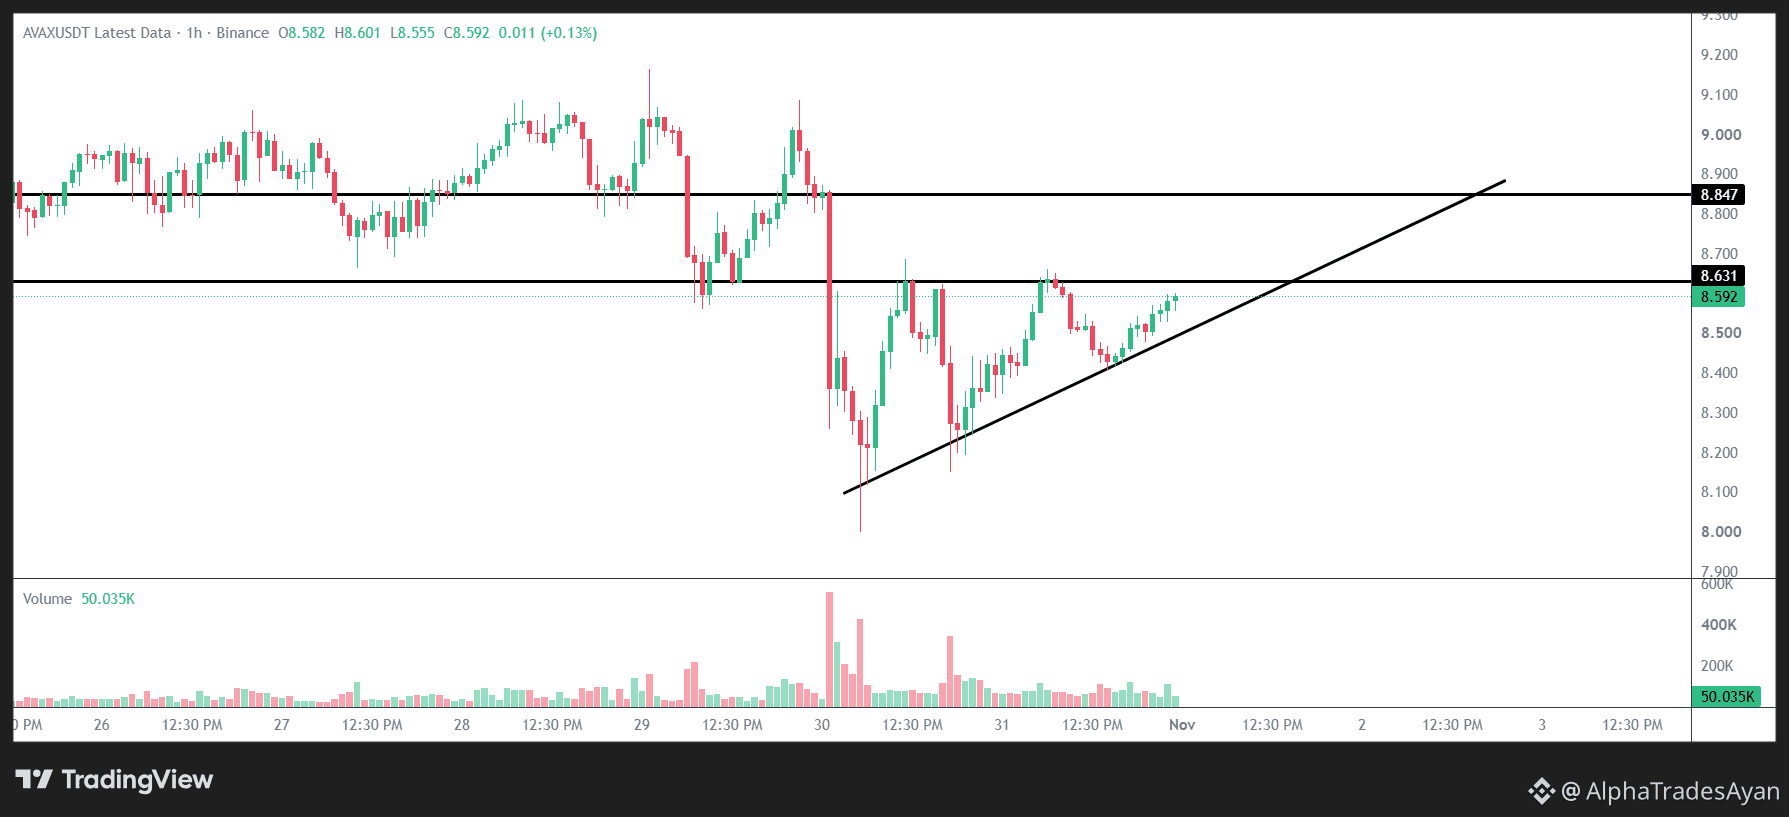
🚨 Tracking the exact price action structure on the $AVAX 1H chart.
Price is currently compressing within a very tight structural zone. We can see a clear ascending trendline providing dynamic support from below, while the price is repeatedly testing the horizontal boundary at 8.631.
Here are the exact price action levels I am observing on this timeframe:
🚧 Immediate Resistance (Pivot): 8.631
🛑 Major Ceiling: 8.847
📈 Dynamic Support: Ascending Trendline
$AVAX
I am not front-running any moves here. Just keeping a close watch on how the price reacts as it gets squeezed between this trendline and the 8.631 resistance. A clean 1H candle close outside this compression zone will provide more clarity on the next structural shift.
Let's observe how the market respects these critical boundaries. 👇
NFA | DYOR
Price is currently compressing within a very tight structural zone. We can see a clear ascending trendline providing dynamic support from below, while the price is repeatedly testing the horizontal boundary at 8.631.
Here are the exact price action levels I am observing on this timeframe:
🚧 Immediate Resistance (Pivot): 8.631
🛑 Major Ceiling: 8.847
📈 Dynamic Support: Ascending Trendline
$AVAX
I am not front-running any moves here. Just keeping a close watch on how the price reacts as it gets squeezed between this trendline and the 8.631 resistance. A clean 1H candle close outside this compression zone will provide more clarity on the next structural shift.
Let's observe how the market respects these critical boundaries. 👇
NFA | DYOR