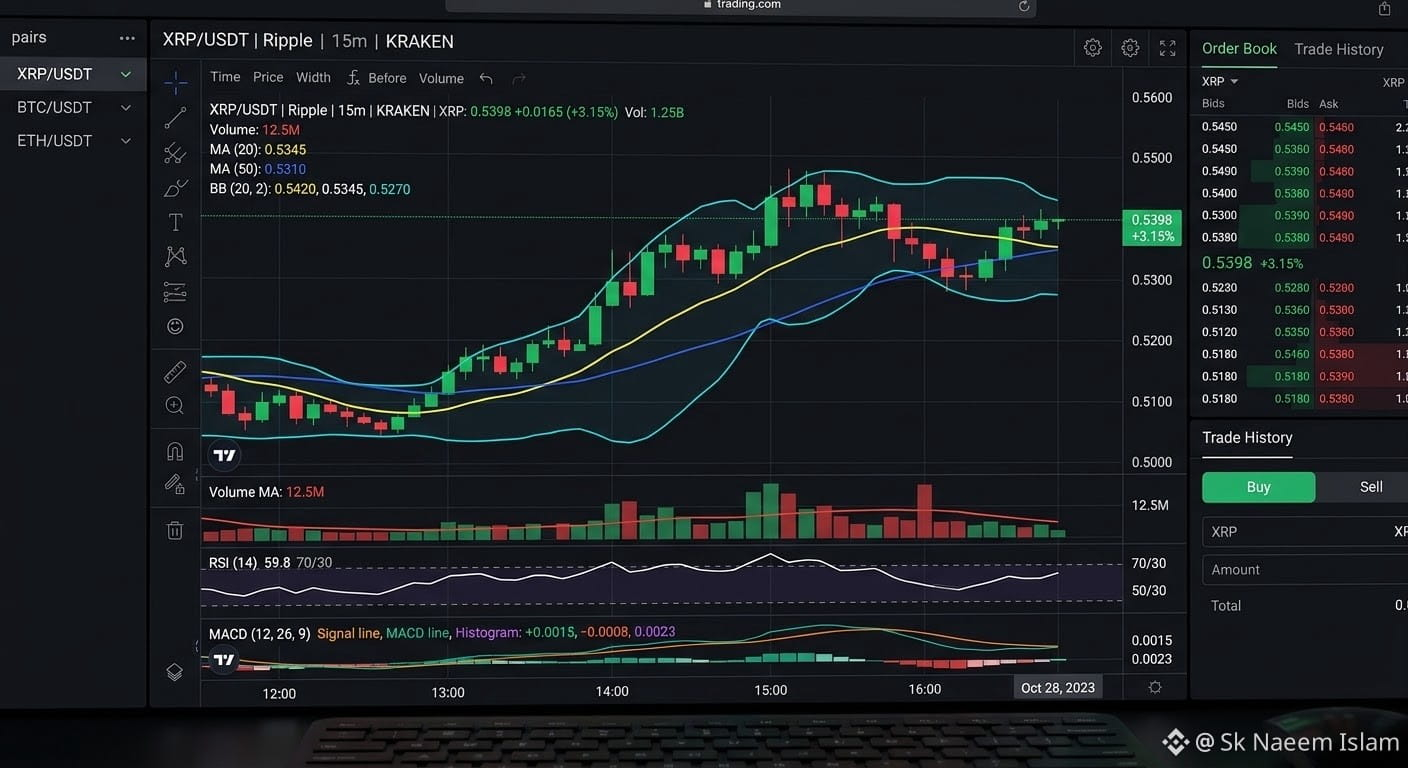
$XRP
Market Overview & Price Action
Current Price: ~$1.21 – $1.25
Short-Term Trend: Bearish / Consolidating (facing selling pressure alongside broader altcoin weakness)
Key Support Zone: $1.20 – $1.25
Key Resistance Zone: $1.34 – $1.37
Candlestick Chart Analysis
Recent Candle Formations (Daily/Weekly Charts):
Recent daily candles reflect a sequence of lower highs following rejection near the $1.34 resistance zone.
Long lower wicks testing the $1.20 – $1.25 local support indicate that buyers are stepping in defensively to prevent a deeper correction, forming a potential local double-bottom structure.
Body sizes have shrunk relative to prior impulsive moves, pointing to a cooling-off period where market participants are hesitant to commit heavily in either direction.
Critical Levels to Watch:
Bullish Reversal Scenario: For a convincing shift in momentum, look for a strong bullish engulfing candle on the daily chart accompanied by high volume, with a confirmed close above $1.34. This would clear the immediate overhead hurdle and target a move back toward $1.37–$1.40.
Bearish Breakdown Scenario: If sellers successfully press the price below the $1.20 – $1.25 support floor on strong volume candles, expect accelerated downside pressure toward the psychological support territory around $1.14.
Summary Outlook
XRP is currently locked in a tight consolidation range between $1.20 and $1.34. Traders should monitor how price action reacts around the $1.25 support level; holding this floor keeps consolidation alive, while a breach opens the door to near-term downside risk.
#BinanceSAFUFundTransferCompleted7499BTC #YiHe:ProofOfReserves:10TokensAt100%Backing #BackedNotBroken:RichardTengSaysUsersBearNoLoss #IntelHasItsWorstDaySince1974 #USDCCirculationFallsAbout800MInSevenDays $XRP