⚔️ ZEC vs ETH Which Chart Looks Stronger?
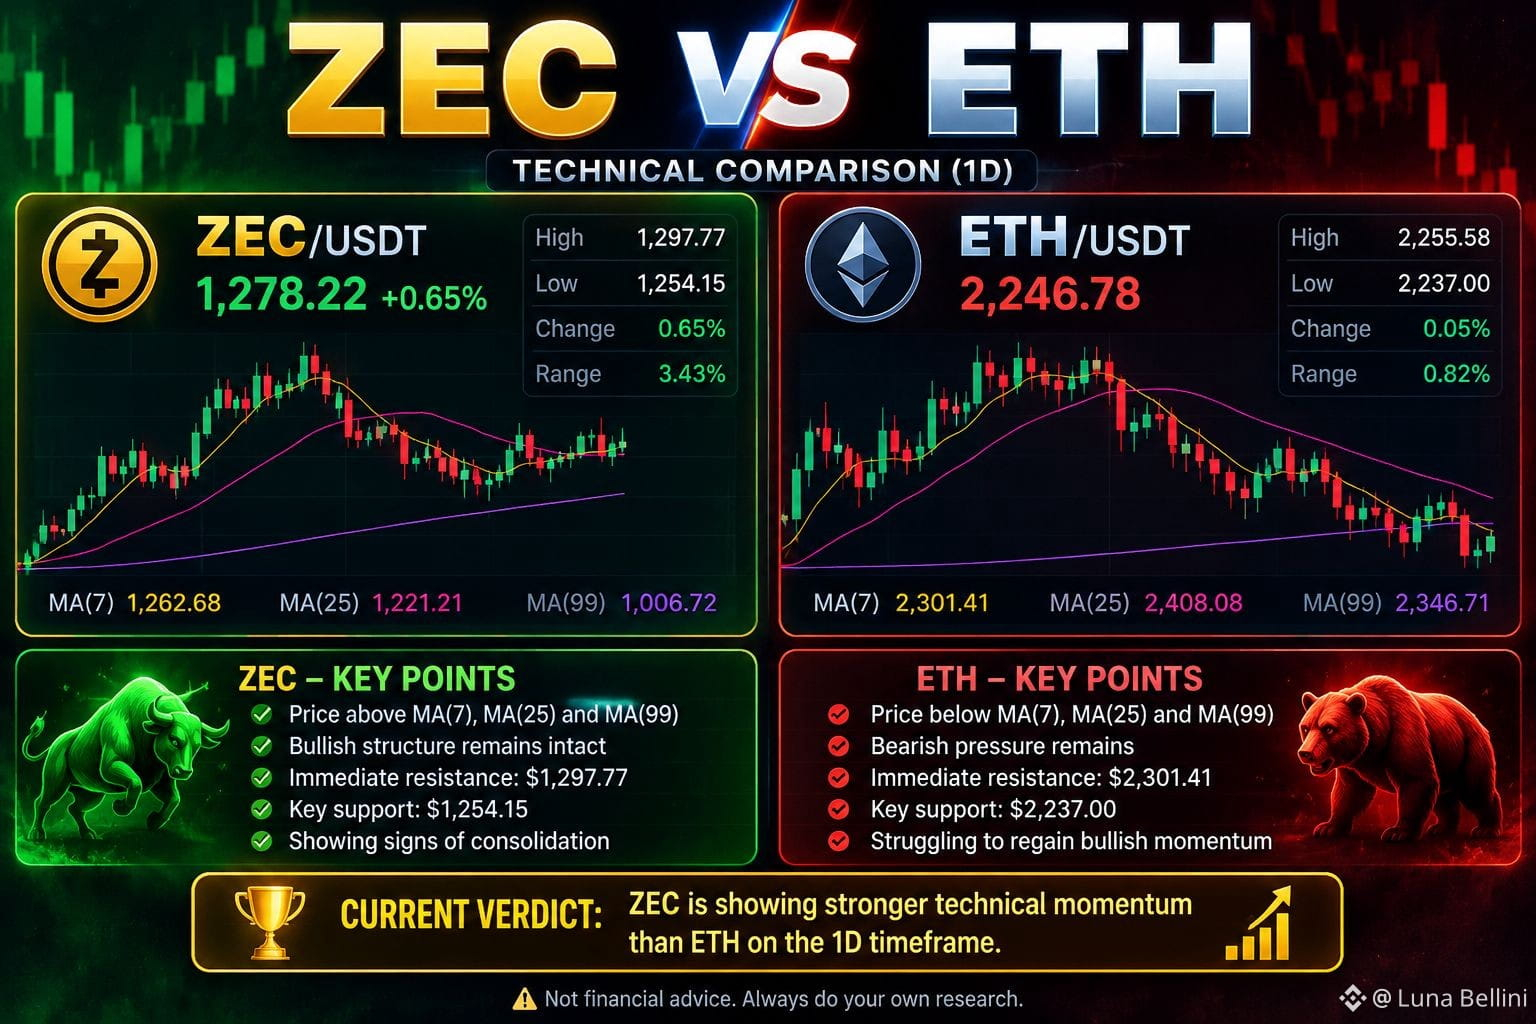
📈 $ZEC Maintaining a bullish structure, trading above MA(7), MA(25), and MA(99), with resistance near $1,297.
📉 $ETH Showing weaker momentum, trading below its key moving averages, with sellers still in control.
🔍 Current Verdict: ZEC is showing stronger technical momentum than ETH on the 1D timeframe. However, confirmation is needed before expecting further upside.
⚠️ Not financial advice