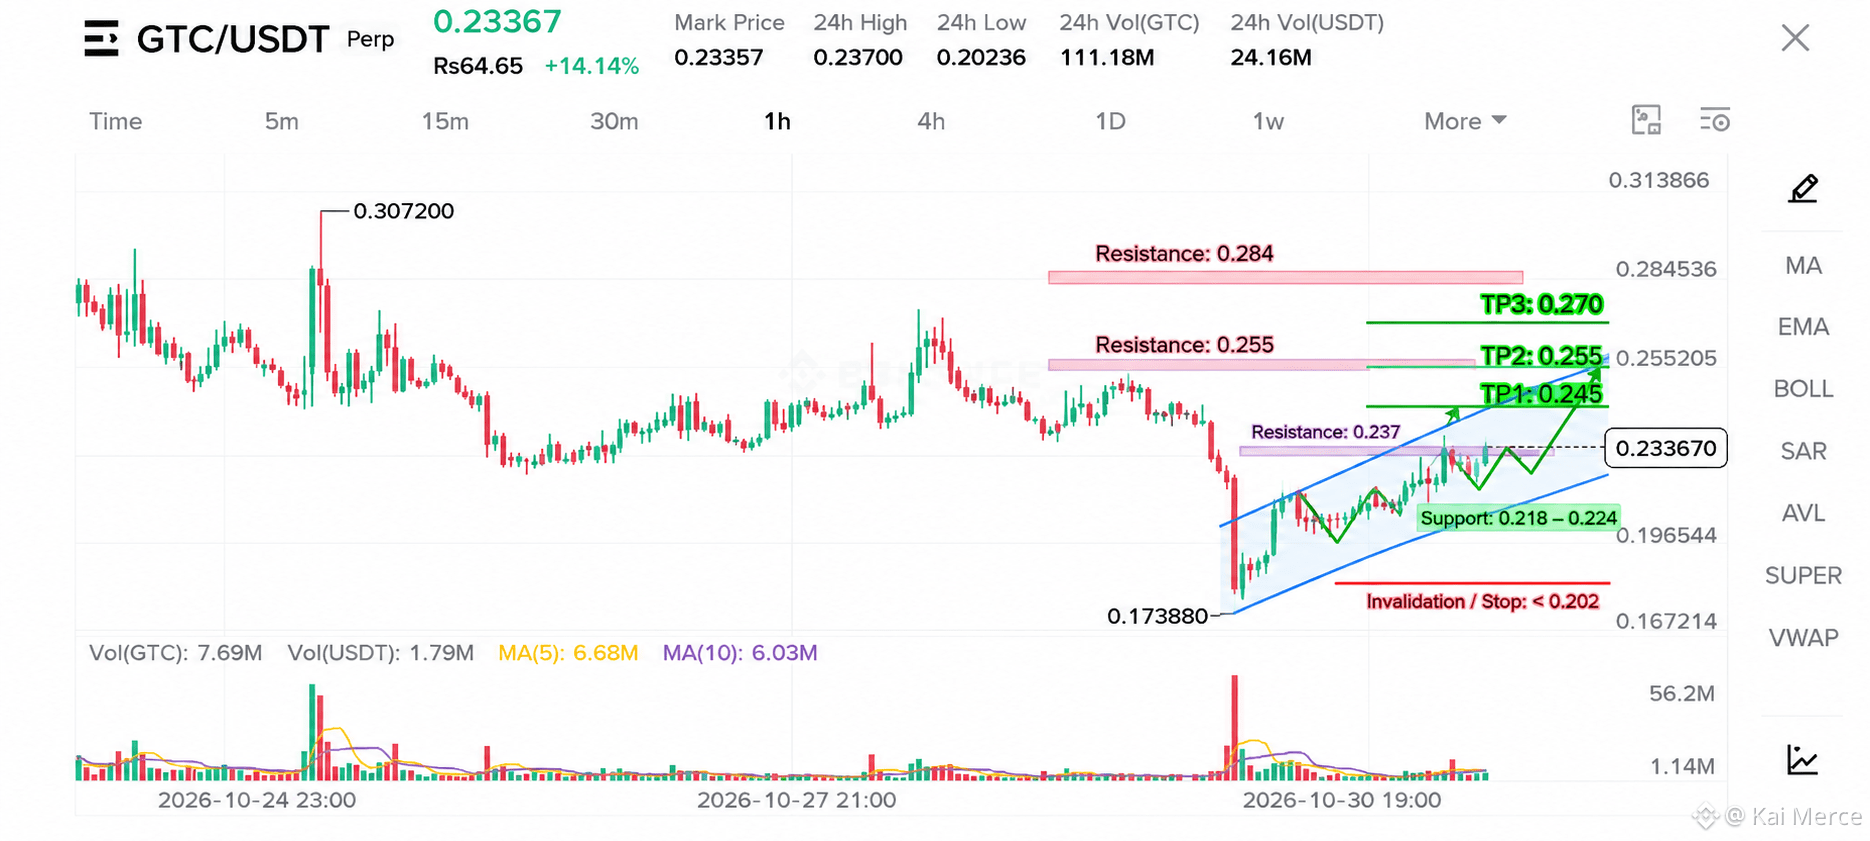

$GTC A Recovery Channel Meets a Major Breakout Zone
LONG SETUP
Entry Zone: 0.2180 – 0.2240
Stop Loss: 0.2020
TP1: 0.2450
TP2: 0.2550
TP3: 0.2700
Technical Analysis
GTC is attempting a bullish recovery after a sharp sell-off toward 0.17388. The 1H chart shows price building an ascending channel, with higher lows suggesting that buyers are gradually regaining control.
Currently trading near 0.23367, GTC is testing the important 0.237 resistance level. A confirmed breakout above this area could strengthen the bullish structure and open the way toward 0.245.
The next major resistance lies around 0.255. If buyers maintain momentum and overcome this barrier, the 0.270 target becomes a potential extension.
The 0.2180–0.2240 region is the key support area to monitor during a pullback. Holding this zone could keep the recovery structure intact.
Preferred Entry: Look for a controlled retest of the support zone with a bullish reaction.
Confirmation: A strong 1H close above 0.237, followed by a breakout above 0.245 with volume confirmation.
Invalidation: A sustained breakdown below 0.2020 would invalidate the bullish setup.
GTC is approaching a decisive level. The next move depends on whether buyers can turn resistance into support and sustain the recovery.
Trade with discipline and manage risk carefully.