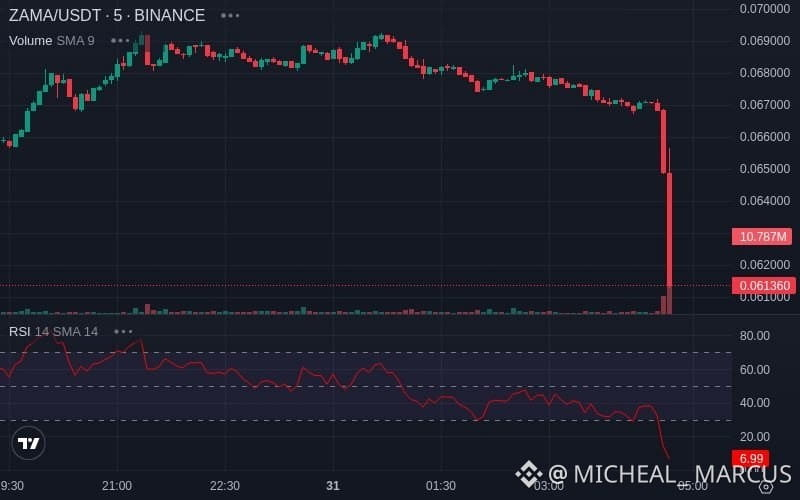

$ZAMA just experienced a heavy whale sell-off — and the chart is showing the damage.
Something changed very quickly in ZAMA. After holding around the $0.067–$0.069 range for hours, the price suddenly collapsed toward $0.06136.
The bigger concern isn't just the red candles. It's the size of the selling activity behind them.
According to the whale activity data:
→ 4.31M ZAMA sold in a short period.
→ $274.89K in reported order size.
→ Selling activity lasted just 10 minutes.
→ Price dropped 8.39% to $0.0613.
→ Trading volume surged alongside the breakdown.
But there's another detail worth watching: RSI has fallen to 6.99.
That's an extremely oversold reading. It shows how aggressively price has moved down, but it also increases the possibility of a sudden relief bounce.
Key levels to watch:
→ $0.0630: First recovery level.
→ $0.0650: Important resistance.
→ $0.0670: Previous support, now a potential selling zone.
→ $0.0610: Immediate downside support.
→ $0.0600: Psychological level if selling continues.
My take: The short-term structure is strongly bearish, and whale selling has added pressure. However, shorting after such an aggressive drop carries its own risk. A weak recovery toward $0.0630–$0.0650 followed by rejection would provide a more convincing bearish confirmation.
The important question now is whether buyers can absorb the whale supply or whether more downside is waiting.