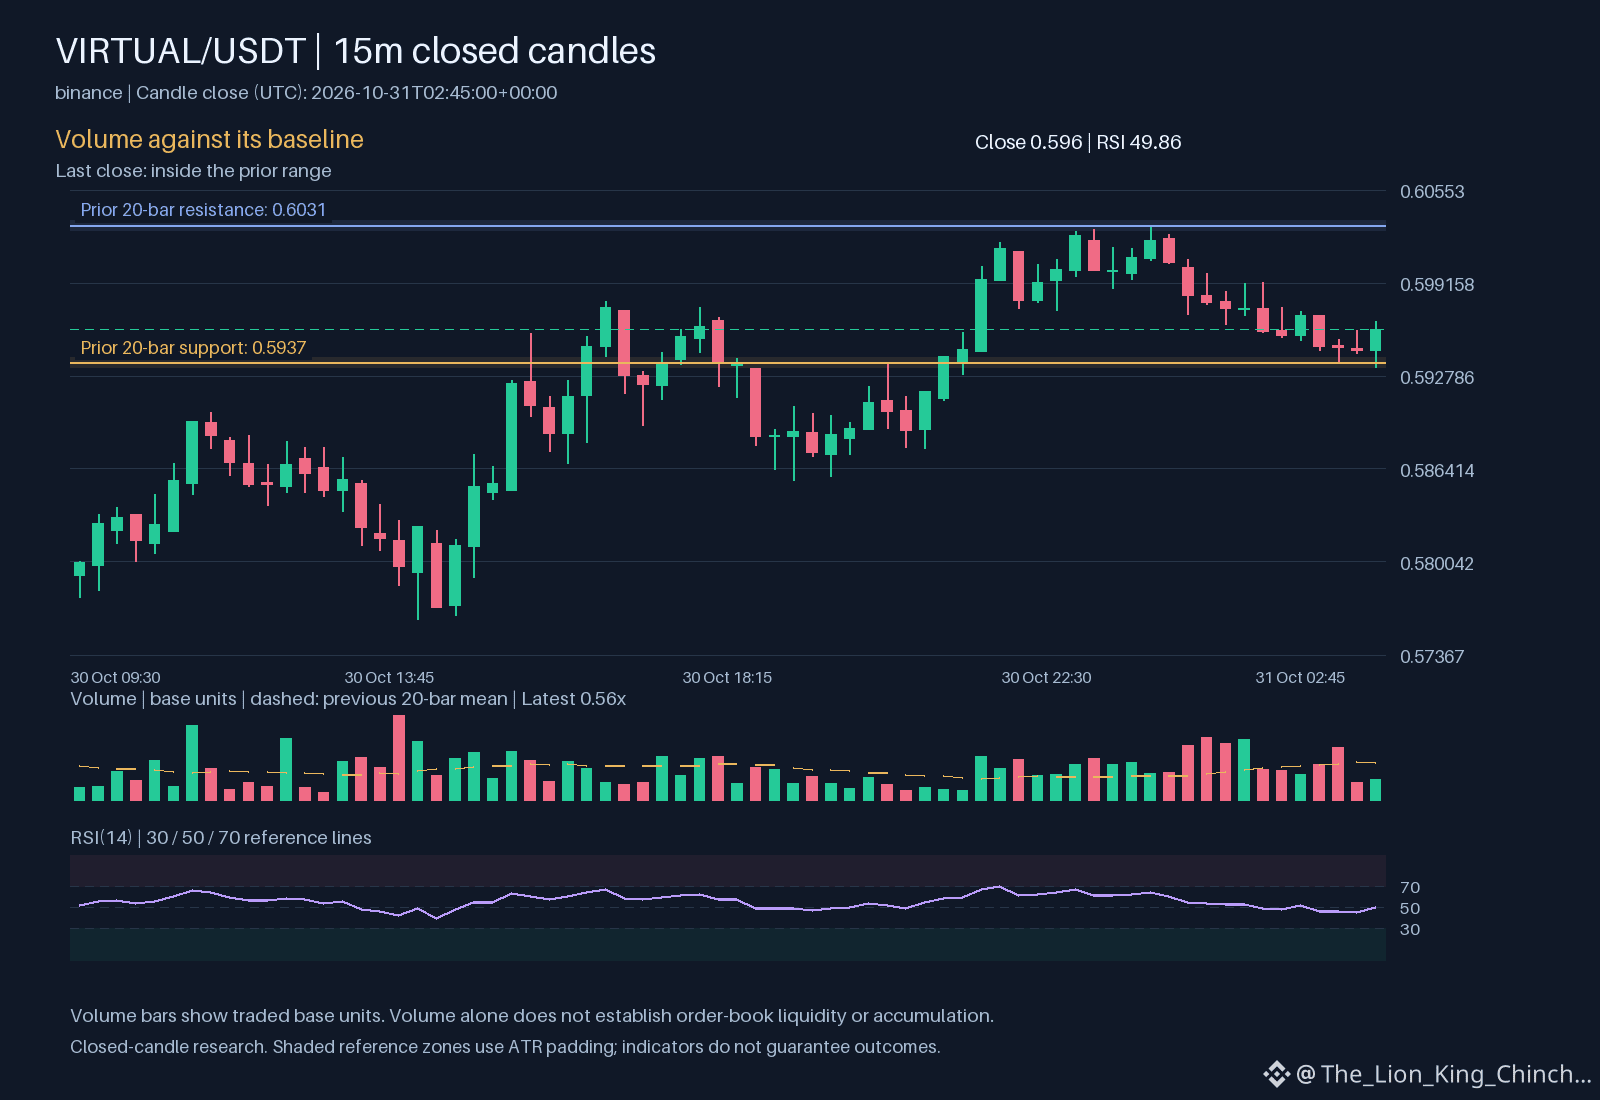
$VIRTUAL: VIRTUAL: Interpreting the Downward Drift
The current clue is a modest decline on the hourly chart while price remains inside its recorded range and volume stays near baseline. A clean close below the recent low would suggest that sellers have taken control, reinforcing the down‑trend hypothesis. The mechanism behind this reading is simple: lower momentum, reflected by RSI 49.8563, combined with a shrinking ATR 0.00278961, often signals reduced buying interest and a higher probability of continuation.
An alternative reading sees the same move as a temporary pullback within a broader sideways market. If the price were to bounce back toward the range upper bound and hold, it could indicate that the down move was merely noise, perhaps caused by a short‑term order imbalance rather than a shift in sentiment.
What would weaken each interpretation? A clean close would lose force if the next hourly candle shows a strong rebound, especially if relative volume rises above baseline and pushes price back toward the resistance 0.6031. Conversely, the pullback scenario would be undermined if volume remains thin and the price fails to reclaim the upper range, leaving the decline unchallenged. Monitoring one clear metric. RSI 49.8563. alongside volume can help you reassess which story is playing out. 🙂
Probabilistic market research, not a recommendation or guaranteed return.
What would convince you: a clean close or a patient retest?
#VIRTUAL