🚀 #AİN : Explosive Rally! Is $0.22 Next or Is a Major Correction Coming?
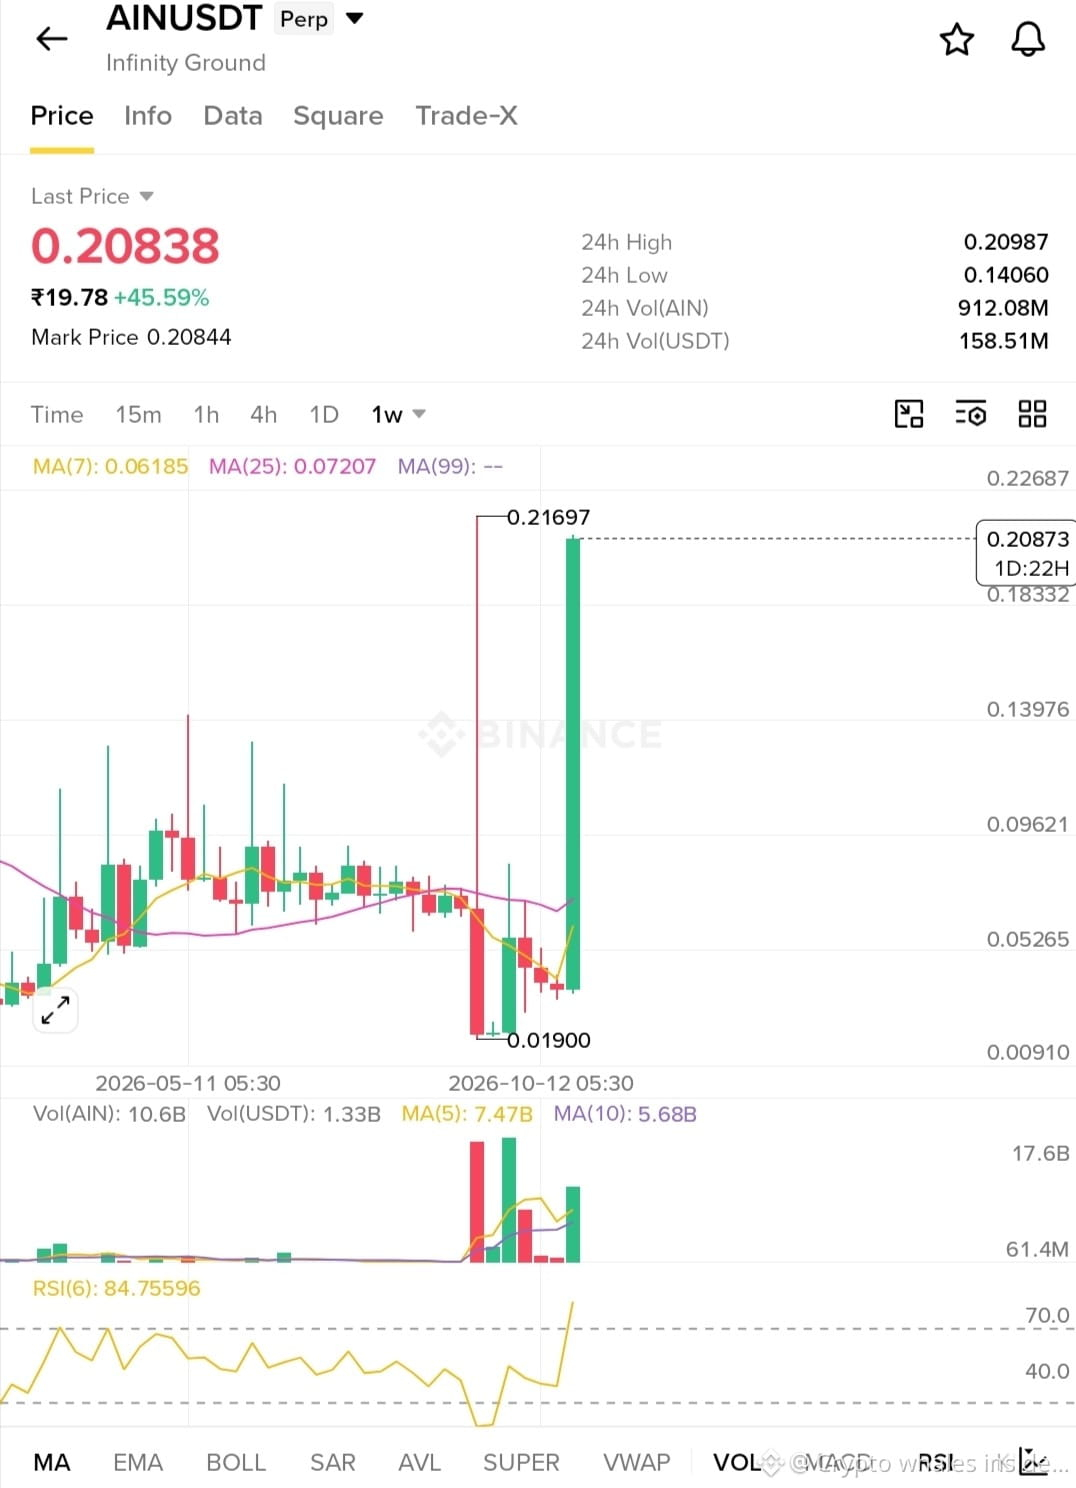
$AIN is trading near $0.2084, up around 45.6% on the 24-hour snapshot. The weekly chart shows a green expansion candle after a base, with a recent swing high near $0.21697. Volume has expanded, confirming strong participation. However, RSI(6) near 84.8 signals an overheated move, so chasing at current prices carries elevated pullback risk.
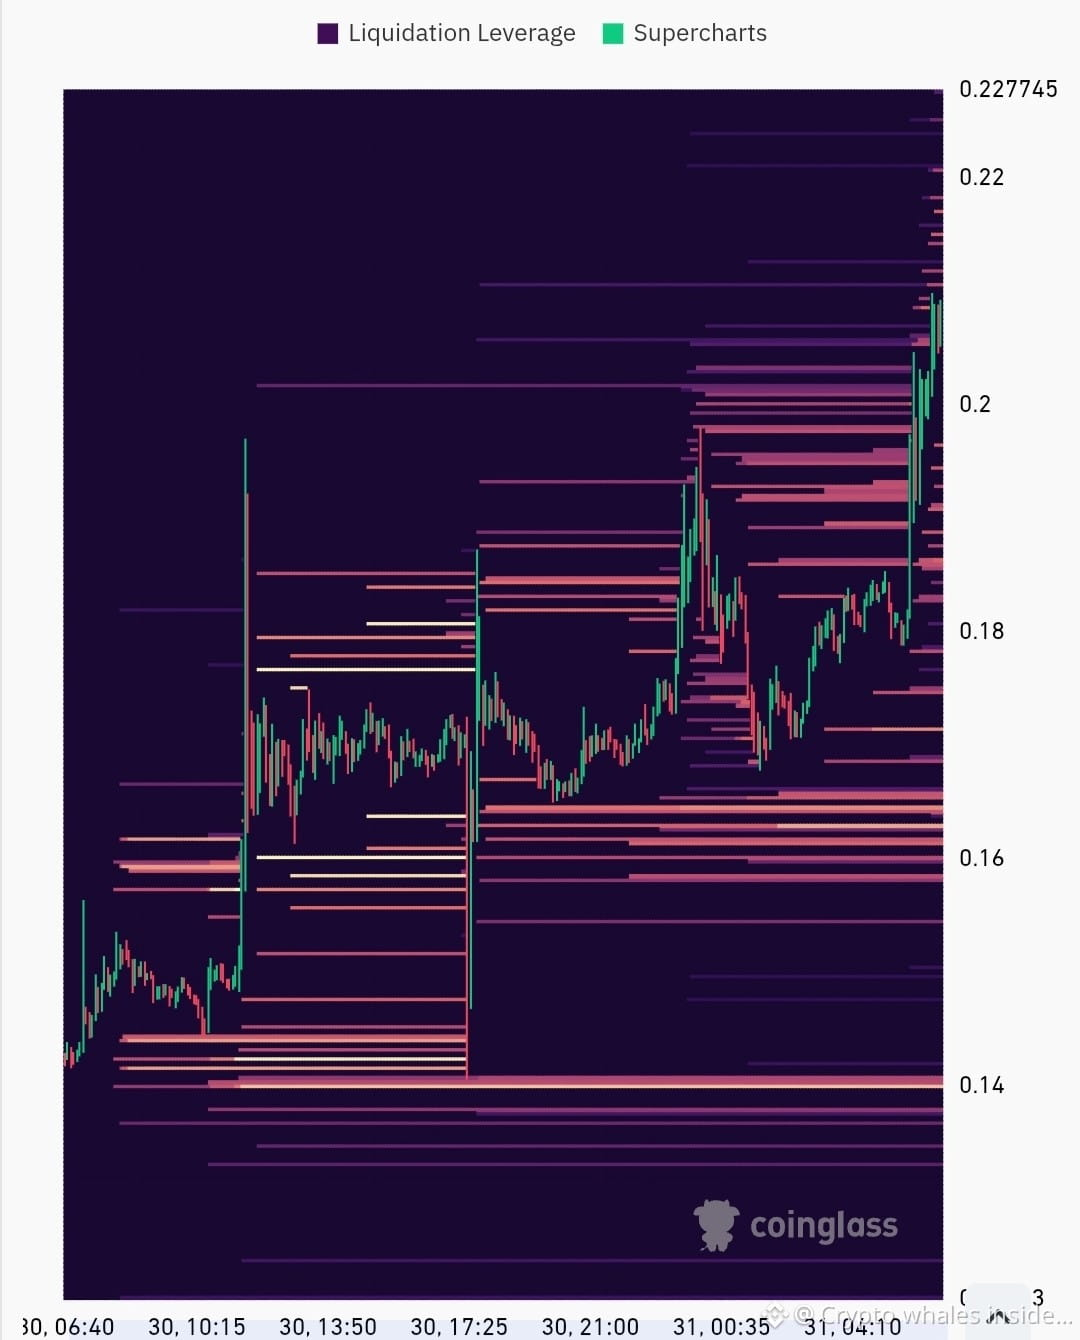
The liquidation heatmap shows liquidity around $0.21–$0.22 above price, while downside liquidity is visible around $0.20, $0.18 and especially $0.16–$0.14. These are potential reaction zones. A sweep above $0.21 could attract price, but rejection near the recent high may trigger a fast retracement.
TRADE PLAN (educational, not financial advice)
🟢 LONG: Wait for a 15m/1h close above $0.210–$0.217, then a successful retest. Entry: $0.213–$0.217 after confirmation. Stop: below the retest low (or invalidate below $0.205). Targets: $0.220, $0.228, then trail if momentum continues.
PULLBACK LONG: Watch $0.195–$0.200 for a bullish reversal; stop below the confirmed swing low. Avoid buying blindly.
🔴 SHORT: Only consider a rejection at $0.217–$0.220 with bearish confirmation; stop above the rejection high. Targets: $0.200, then $0.185.
Risk max 0.5–1% per trade. No confirmation, no trade. Protect capital first. Trade responsibly. What’s your bias—breakout or pullback?
#AIN #AINUSDT #Binance #CryptoTrading #Altcoins #LiquidationHeatmap #TechnicalAnalysis #CryptoSignals #TradingStrategy #Bitcoin❗