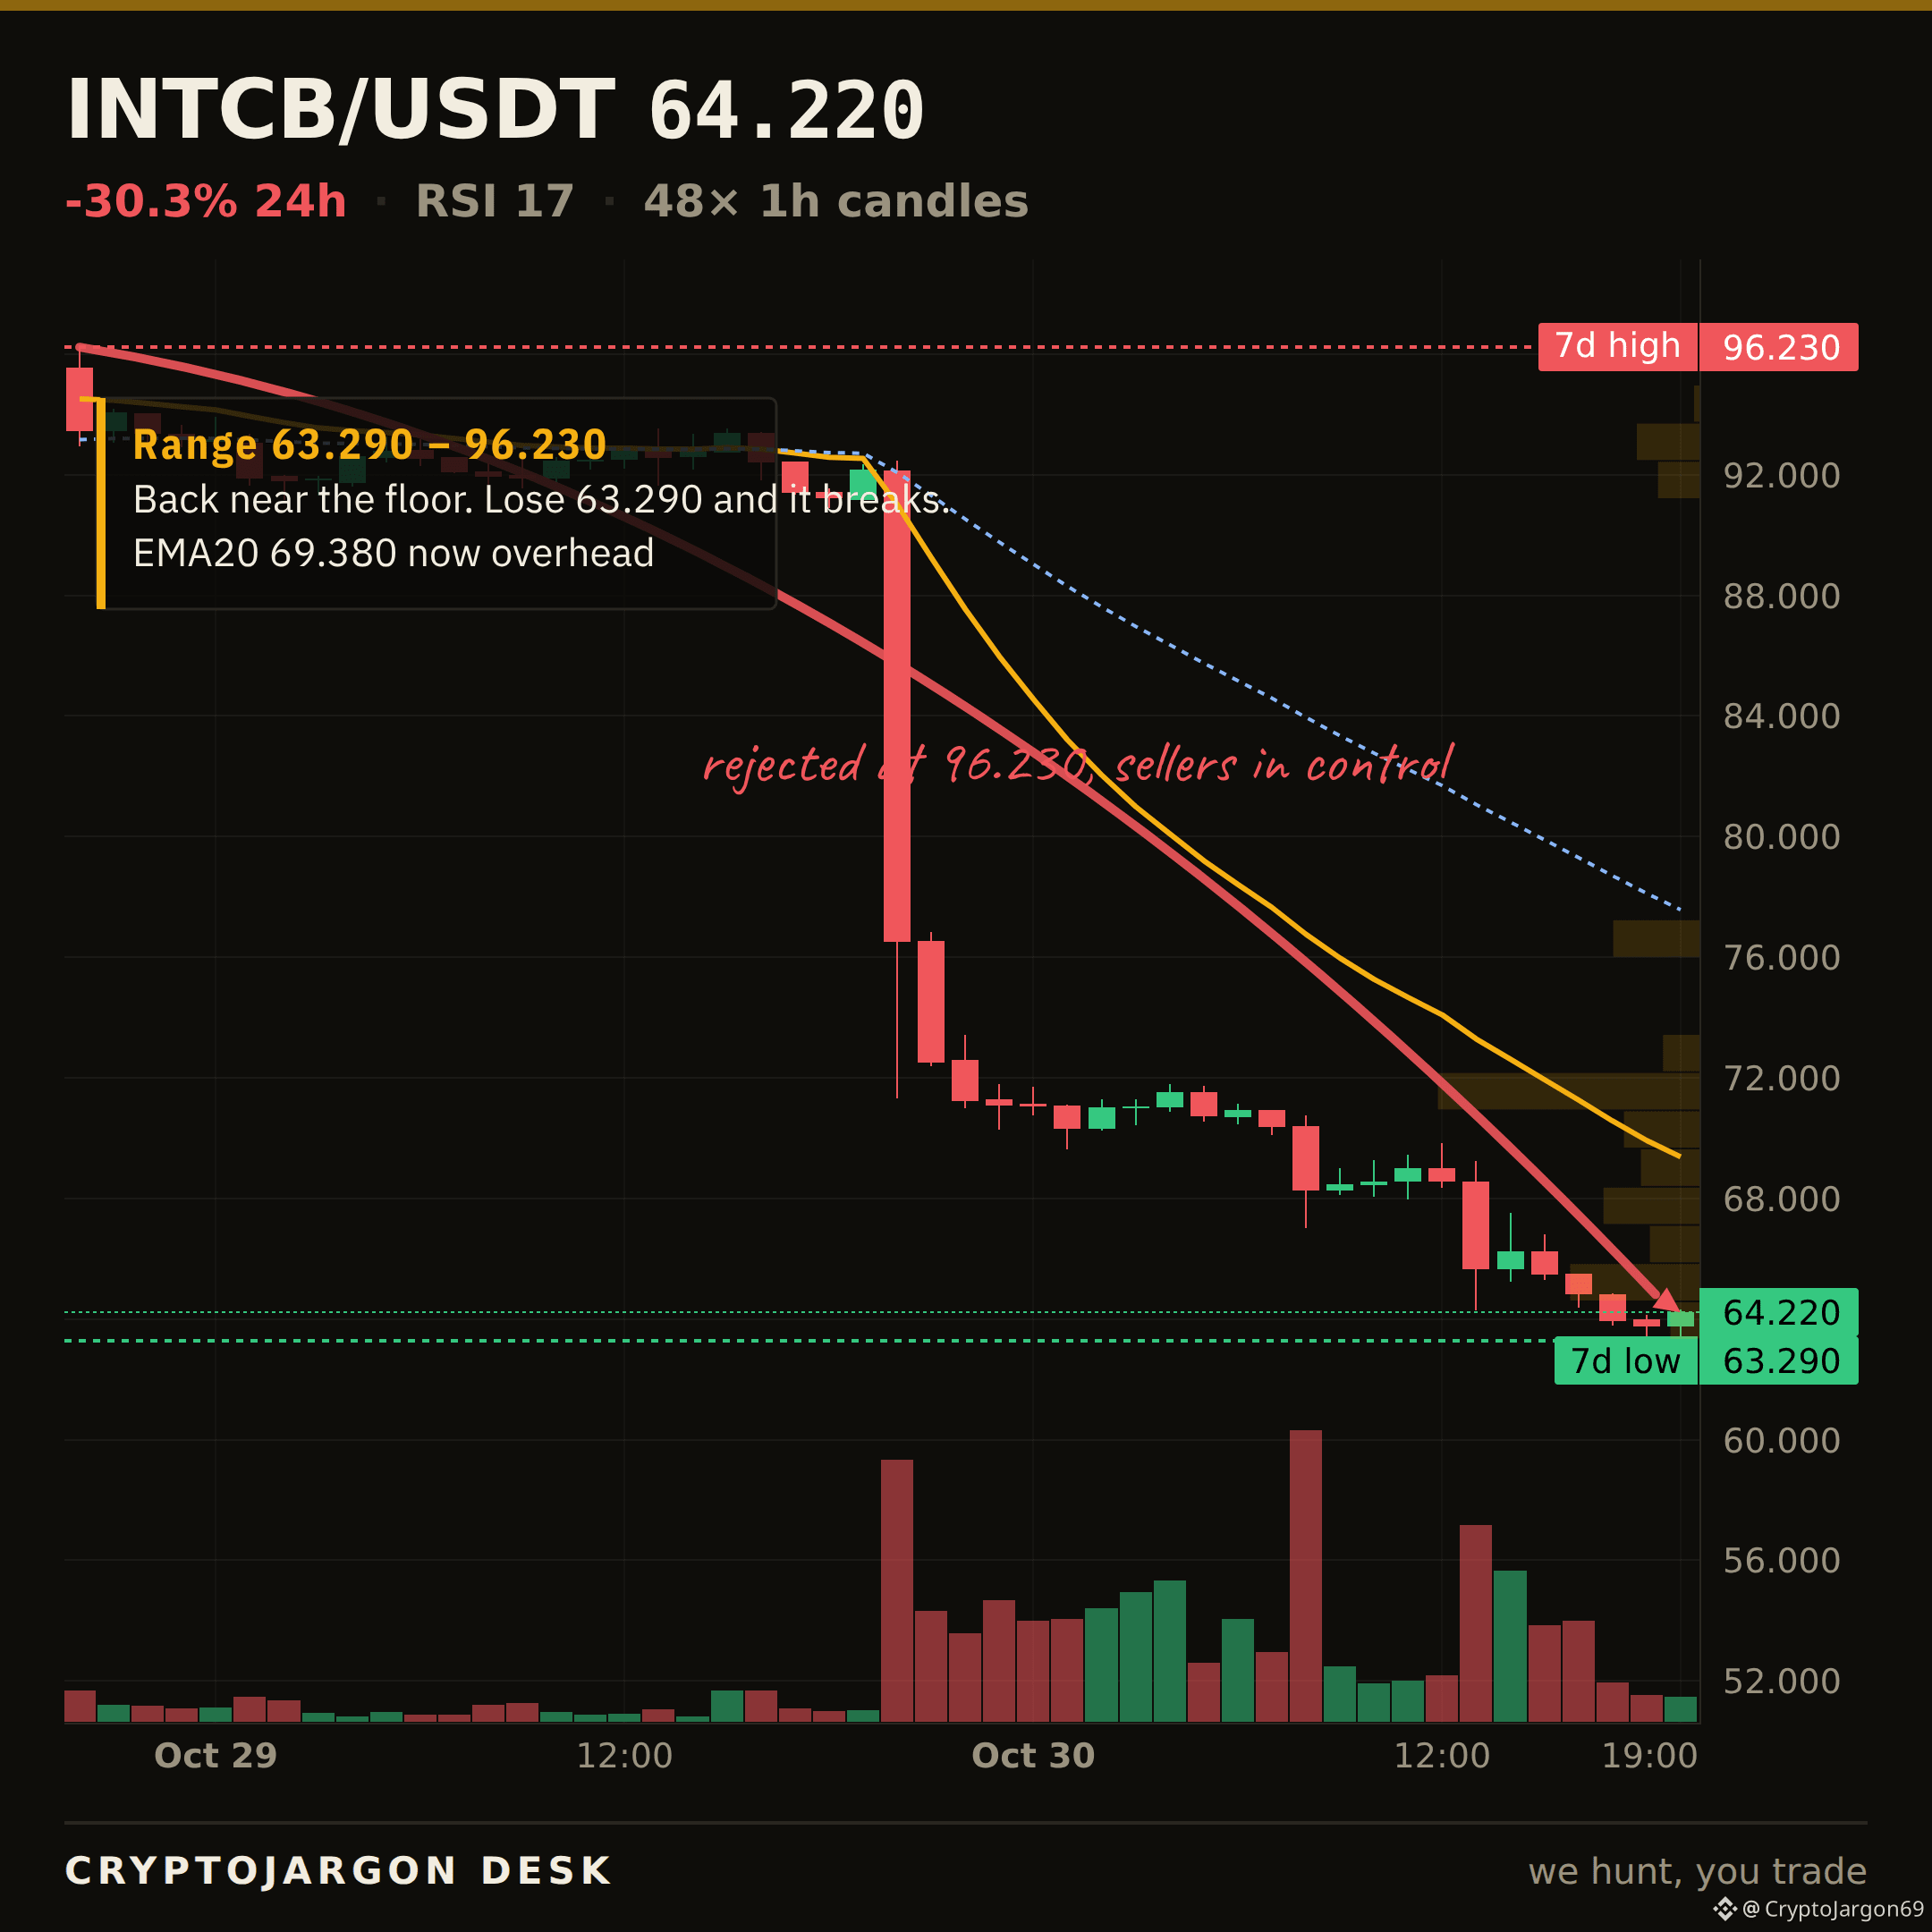

INTCB sold off 30.2% on $62M volume, printing the 7-day low.
A clean break of structure below the 20 and 50-day EMAs. The tape is entirely one-sided. And yet, the RSI is sitting at 16. That's a textbook oversold signal against a completely broken trend.
The 16 RSI is begging for a bounce, but the chart is screaming lower. Which signal is the fake-out?
$INTCB
More of these coming today. Follow to catch them as they land.