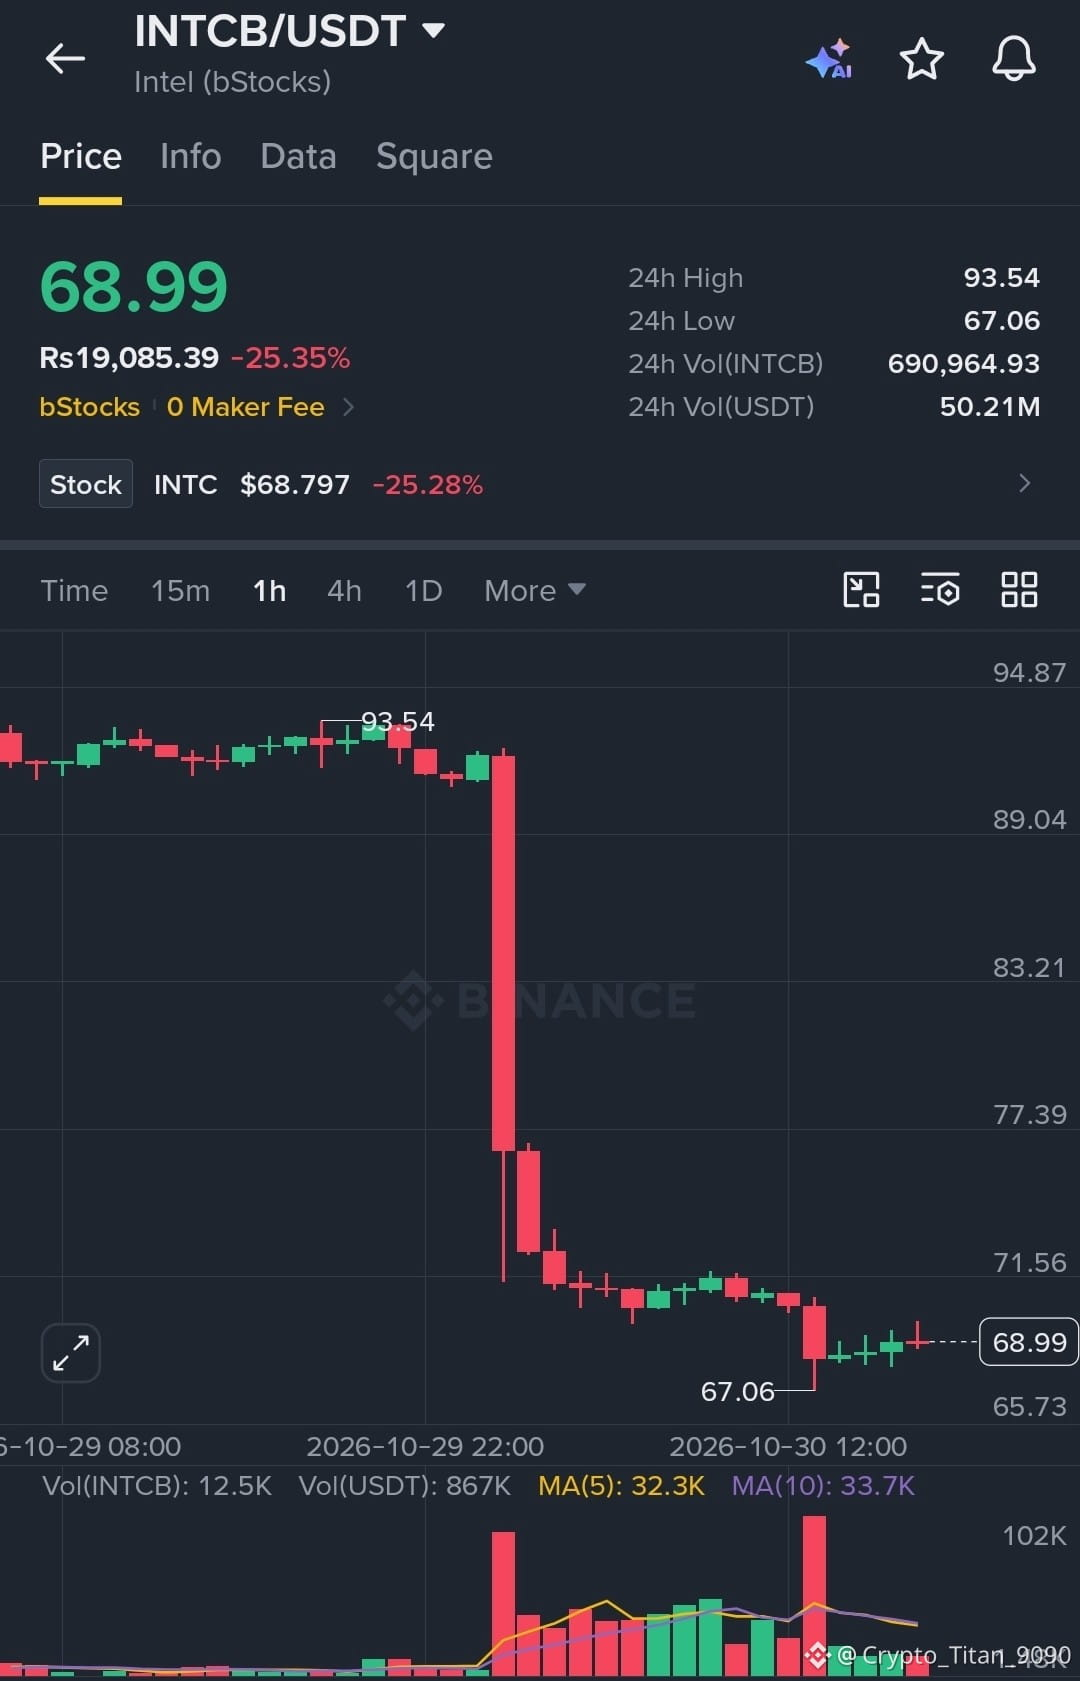
$INTCB · 1H
At $69.02, $INTCB is still trading below the moving averages that previously acted as resistance. The $67.06 level has held on two occasions over the past three days and is being tested once more. Price is currently in the lower third of its range, about 2.8% above support and well below resistance. The 20-period average has remained under the 50-period average for 20 candles, while the RSI at 18 signals deeply oversold conditions.
Over the last 24 hours, the price has ranged from $67.06 to $93.54 and is now near the low end. Trading volume was approximately 7.8 times its usual level. $INTCBis down 25.3% in 24 hours.
⚠️ DYOR
$INTCB #TechnicalAnalysis