

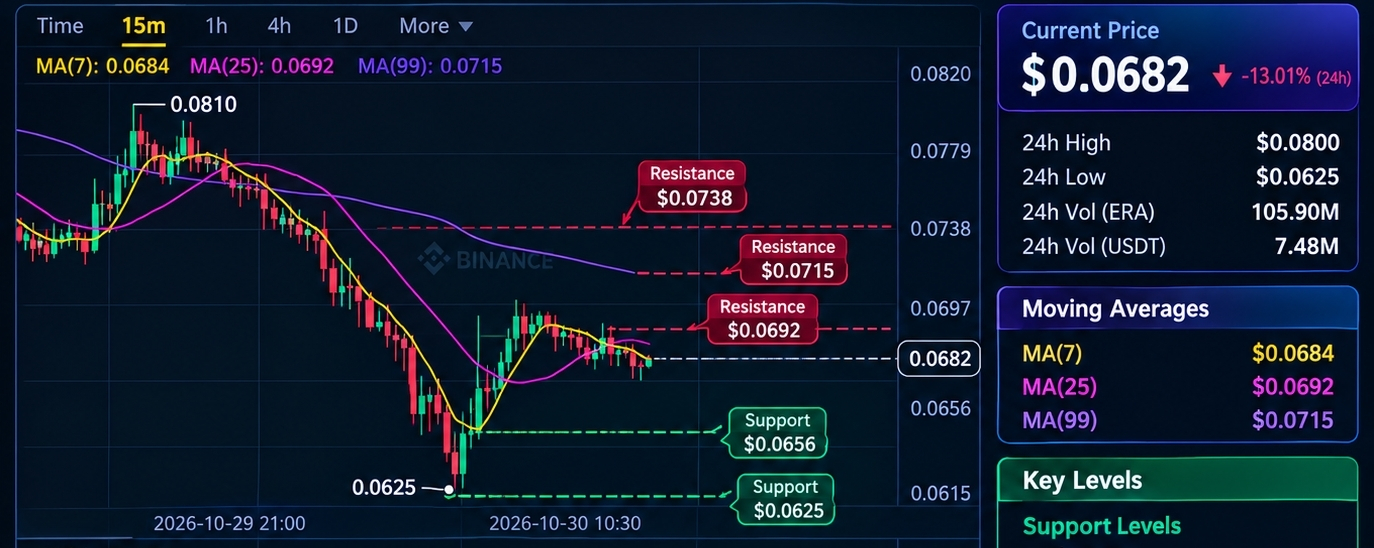

$ERA /$USDT is currently trading around $0.0682, showing a decline of approximately 13.01% over 24 hours.
Looking at the 15-minute chart, ERA is still showing short-term bearish momentum. The price remains below MA(25) at $0.0692 and MA(99) at $0.0715, indicating that sellers currently have the advantage.
Technical Analysis:
Current Price: $0.0682
24H High: $0.0800
24H Low: $0.0625
RSI: 41.65
MA(7): $0.0684
MA(25): $0.0692
MA(99): $0.0715
Important Support Levels:
$0.0656
$0.0625
Important Resistance Levels:
$0.0692
$0.0715
$0.0738
Trading Strategy:
Buyers should wait for a confirmed move above $0.0692 and a successful retest before considering a long entry. A stronger move above $0.0715 could provide further bullish confirmation.
If ERA fails to recover and breaks below $0.0656, the price could revisit its recent low of $0.0625.
My View:
ERA is showing signs of a possible recovery after touching $0.0625, but the current chart does not yet confirm a trend reversal. Traders should avoid chasing sudden price movements and wait for confirmation.
Risk management is essential. Always calculate your stop-loss before entering a trade.
Trade Smart. Protect Your Capital. Wait for Confirmation.
#ERA #ERAUSDT #Binance #CryptoAnalysis #TechnicalAnalysis #StrategySTRCReaches$99.95ForFirstTimeIn165Days SpotTrading #CryptoTrading. ng