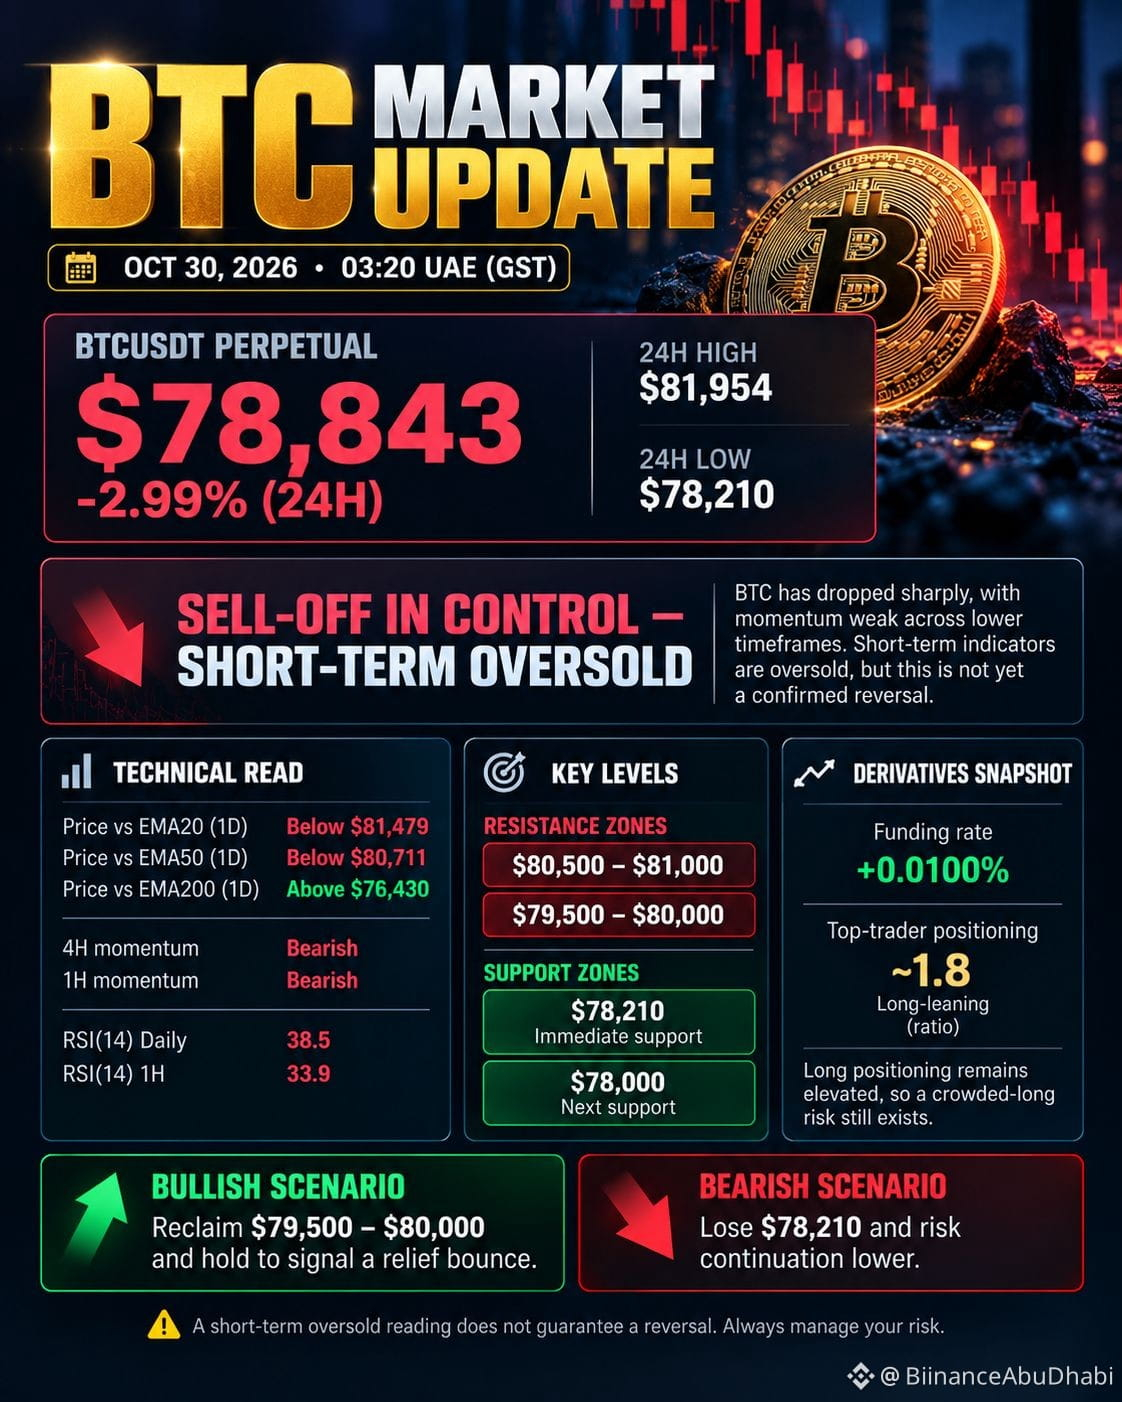
📉 BTC MARKET UPDATE
🗓️ OCTOBER 30, 2026
🕒 03:20 UAE (GST)
.
BITCOIN SELLOFF: IS MORE DOWNSIDE COMING?
.
Bitcoin is trading around $78,843, down approximately 2.99% in 24 hours.
.
The latest charts show strong selling pressure across multiple timeframes. Although short-term indicators are approaching oversold territory, buyers have not yet confirmed a meaningful reversal.
.
🔎 MARKET BREAKDOWN
.
🔴 Daily Trend
.
- BTC below EMA 20 ($81,479).
- BTC below EMA 50 ($80,711).
- Still above EMA 200 ($76,430).
- Daily RSI: 38.5 — bearish momentum.
.
🔴 Lower Timeframes
.
- 4H and 1H momentum remain bearish.
- 15M RSI around 30 — short-term oversold.
- Selling volume increased during the breakdown.
.
⚠️ DERIVATIVES WARNING
.
- Funding rate: +0.0100%.
- Top traders remain long-biased.
- Crowded long positioning creates additional liquidation risk if support fails.
.
🎯 KEY PRICE LEVELS
.
Resistance:
.
- $79,500–$80,000
- $80,500–$81,000
.
Support:
.
- $78,210
- $78,000
- $76,430 (Daily EMA 200)
.
📊 TWO POSSIBLE SCENARIOS
.
🟢 Bullish: Reclaim $79,500–$80,000 and hold. This could open the door to a relief bounce.
.
🔴 Bearish: Break below $78,210 with confirmation. Further downside toward lower liquidity zones becomes possible.
.
MY MARKET BIAS: BEARISH
.
No need to rush into a long position just because RSI is oversold. Wait for confirmation, watch volume, and protect your capital.
.
💡 Remember: An oversold market can become even more oversold.
.
⚠️ Educational market analysis only. Not financial advice. Always manage your risk.
.
#BTC #BinanceSquare $BTC $ETH $ZEC