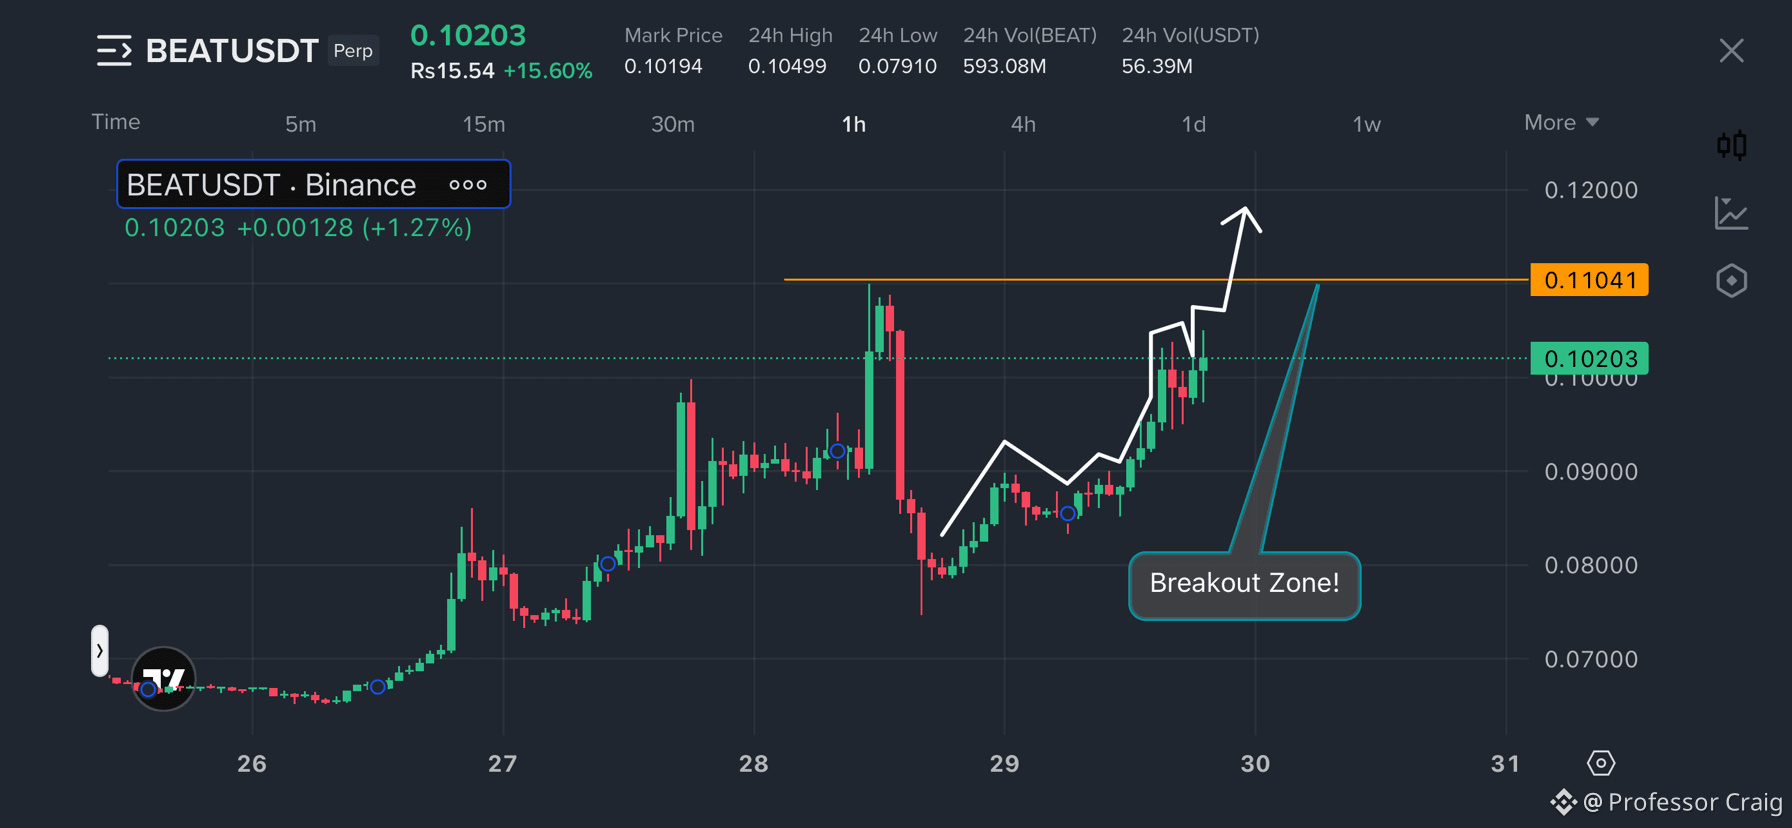
🚨$BEAT is approaching the breakout zone. The real move could start after $0.11!
It is trading around $0.10203, up approximately 15.60% over the last 24 hours. But what catches my attention is not just the green candles. Look at the structure on the 1-hour chart: it has recovered strongly from the $0.065–$0.070 region, built higher lows, and pushed back toward the upper resistance zone.
The breakout zone is marked around $0.11041. Price is approaching this level, and this is where the next major battle between buyers and sellers could take place. The chart’s projected move points toward the $0.11800–$0.12000 region if BEAT successfully breaks through this resistance. That is the potential upside I am watching beyond the breakout zone, not the resistance itself being the final target. The important thing here is momentum. It has already made a substantial recovery, and buyers are pushing price back toward the previous high. If the buying pressure continues and the $0.11041 resistance is broken convincingly, the next upward leg could develop quickly. A breakout followed by a successful retest would make the bullish structure even more convincing.
Long Trading Plan
Entry Range: $0.09900–$0.10200
TP1: $0.11040 ( breakout zone )
TP2: $0.11500
TP3: $0.12000
Stop Loss: $0.09450
A rejection from the breakout zone could still trigger a pullback, so chasing the price without considering risk is not ideal. However, the current structure keeps my attention on the upside.
BEAT is getting closer to the level that matters. Will buyers finally break through $0.11041 and push toward $0.12?
I’ve done analysis for $BTW & $ZEC aswell, so you guys can check that out too.
#beatusdt #BTWUSDT #ZECUSDT