Binance Pumpkin Camp DAY 6
Your first crypto chart can look like chaos. Here is how to read it.
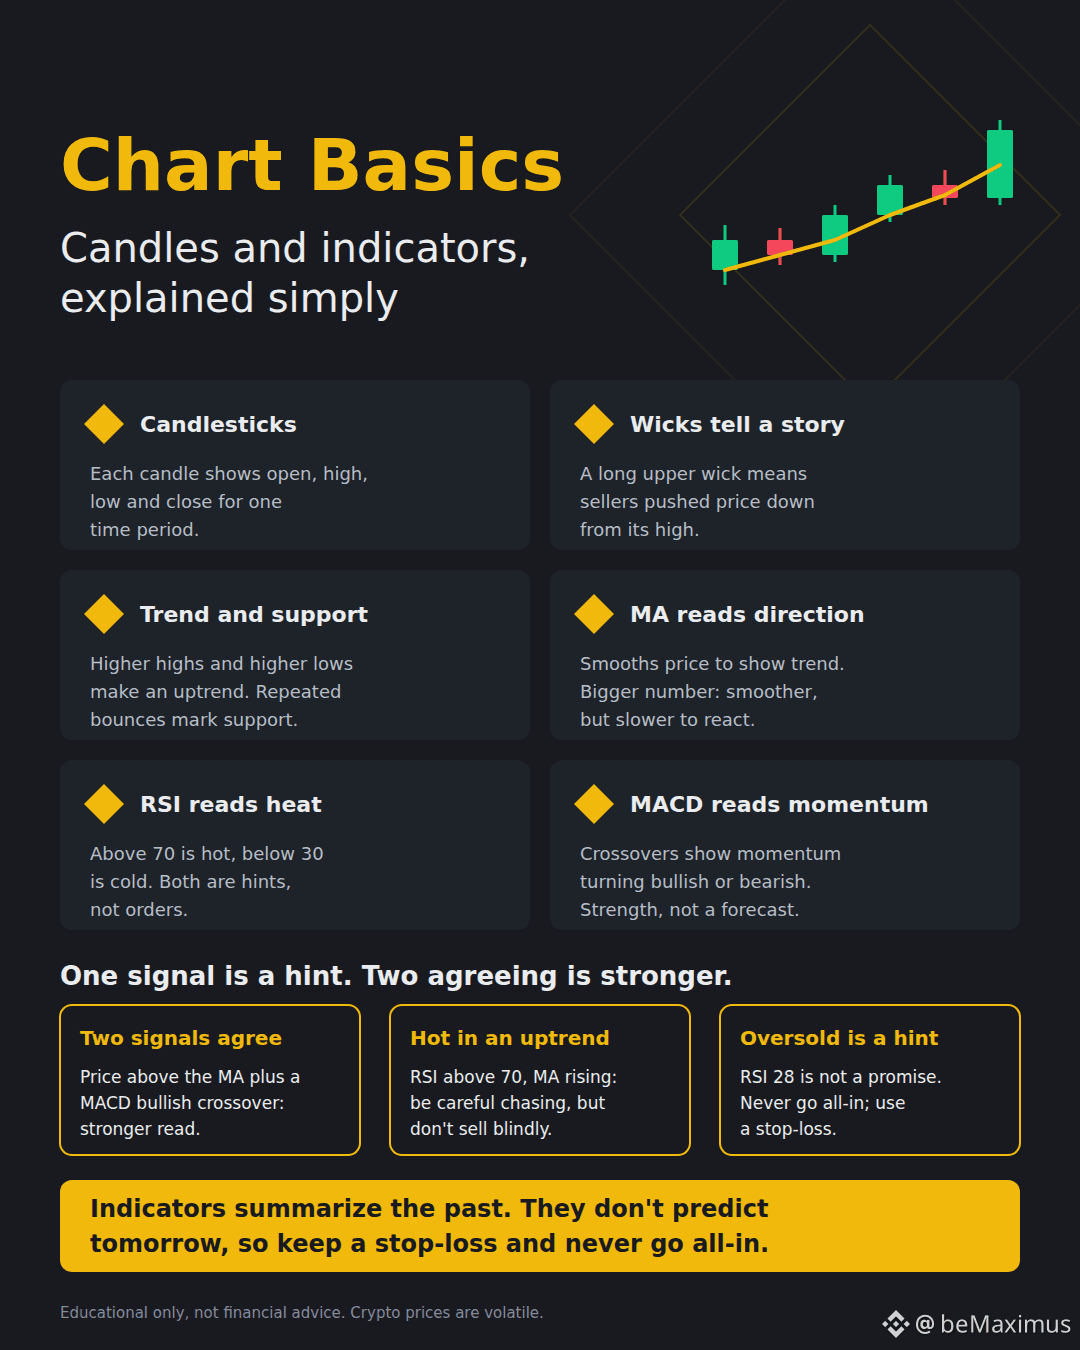
- Each candle shows the open, high, low and close for one time period.
- A long upper wick means sellers pushed price down from its high.
- Higher highs and higher lows make an uptrend. Repeated bounces mark support.
- MA reads direction. A bigger number is smoother but slower.
- RSI reads heat. Above 70 is hot, below 30 is cold.
- MACD reads momentum.
One signal is a hint. Two signals that agree are a stronger read, but still not a guarantee. Oversold does not mean “buy everything,” and overbought does not mean “sell everything.”
Indicators summarize the past. They don’t predict tomorrow. Keep a stop-loss and never go all-in.
#Binance #CryptoBasics #MACD #LearnCrypto