📌 Day 11: Candlestick
A trading chart is like a language. If you can read it, you understand what the market is saying. 📊
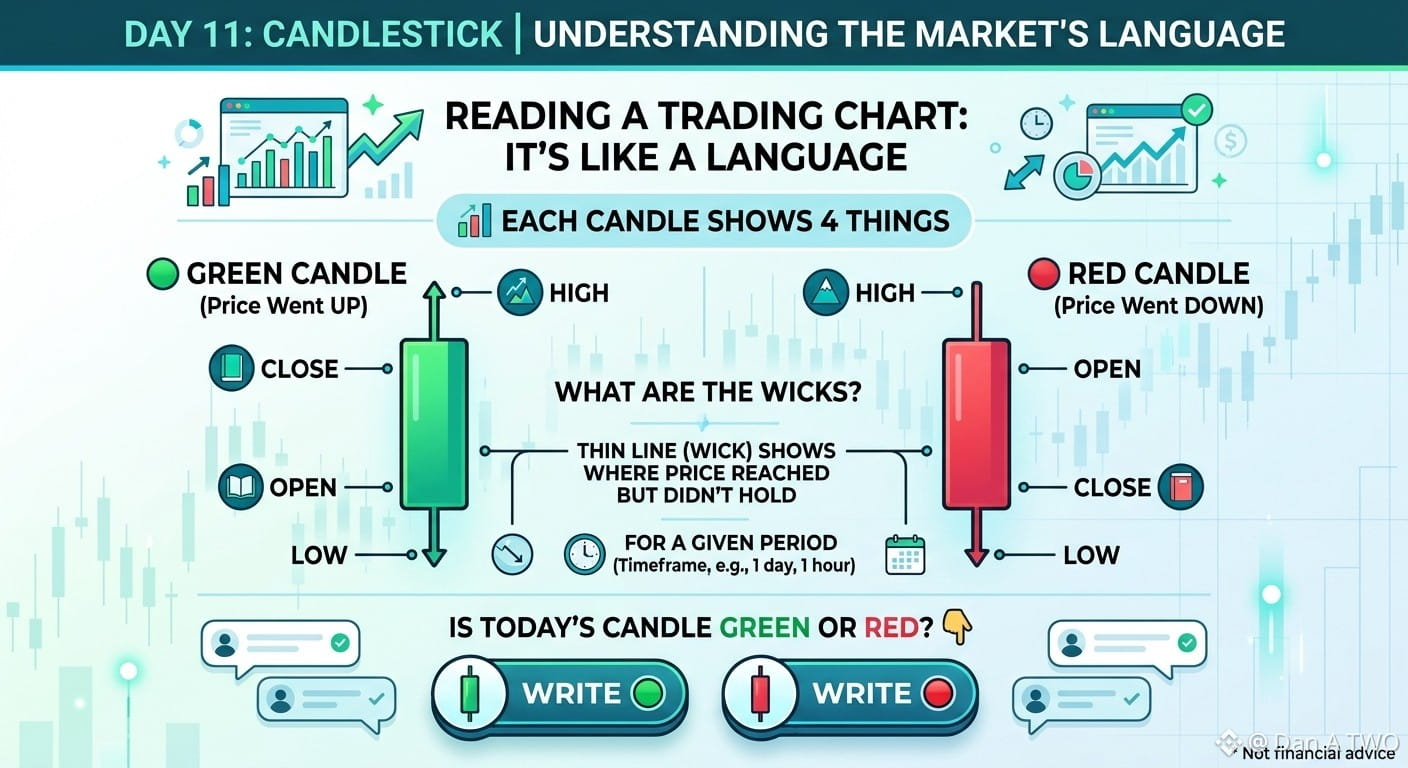
Each candle shows 4 things: the open, the close, the high, and the low for a given period.
🟢 Green: the price went up
🔴 Red: the price went down
The thin line (wick) shows where the price reached but didn't hold.
Is today's candle green or red? Write 🟢 or 🔴 👇
#CandlestickReading #Trading #DanATWO $IDOL $INIT $WEN #BinanceAcademy
Not financial advice.