$BTC
LIQUIDATION HEATMAP
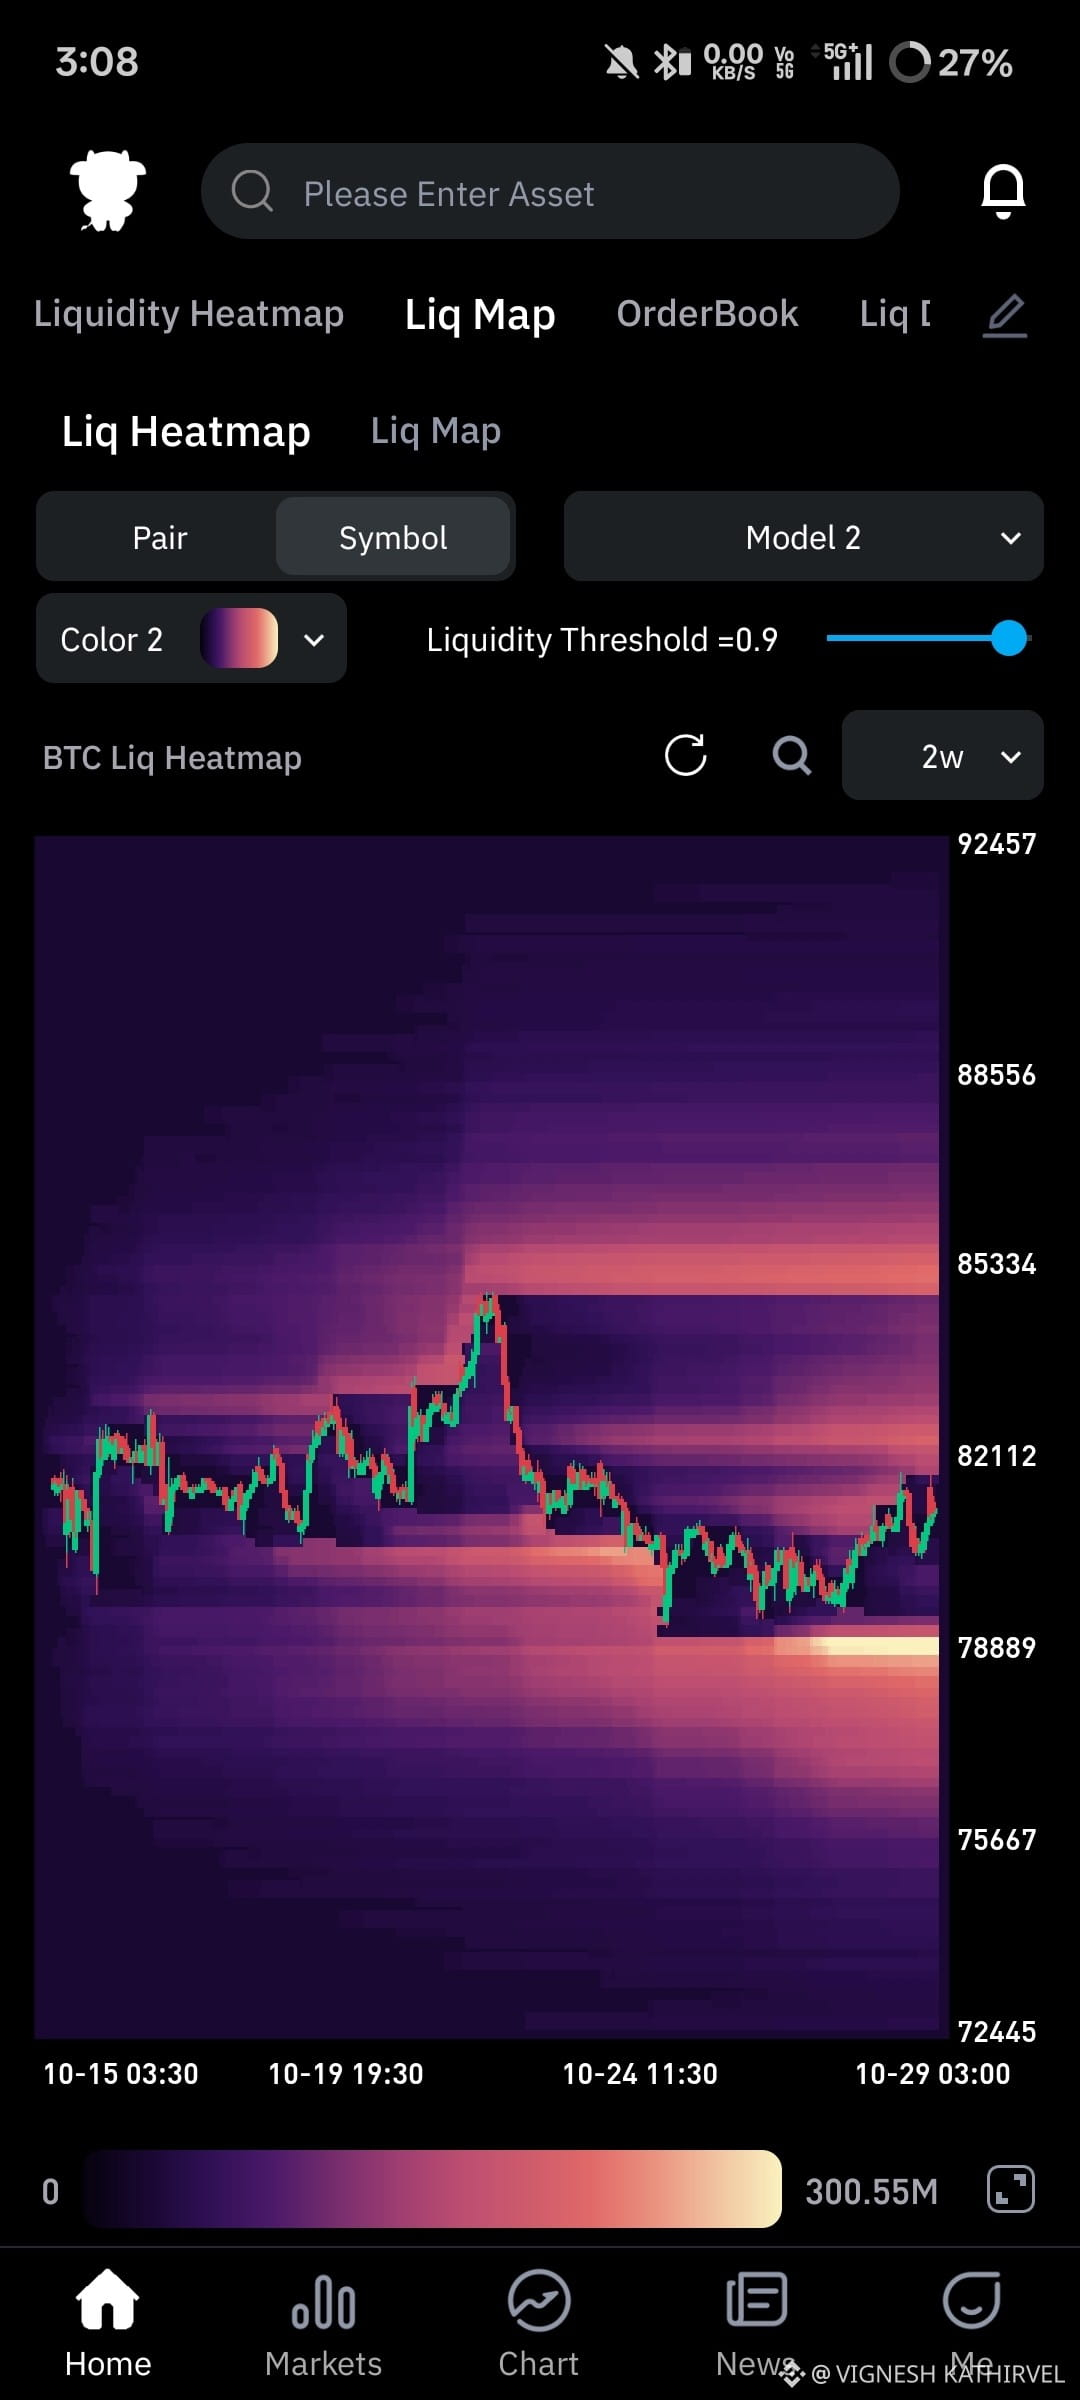
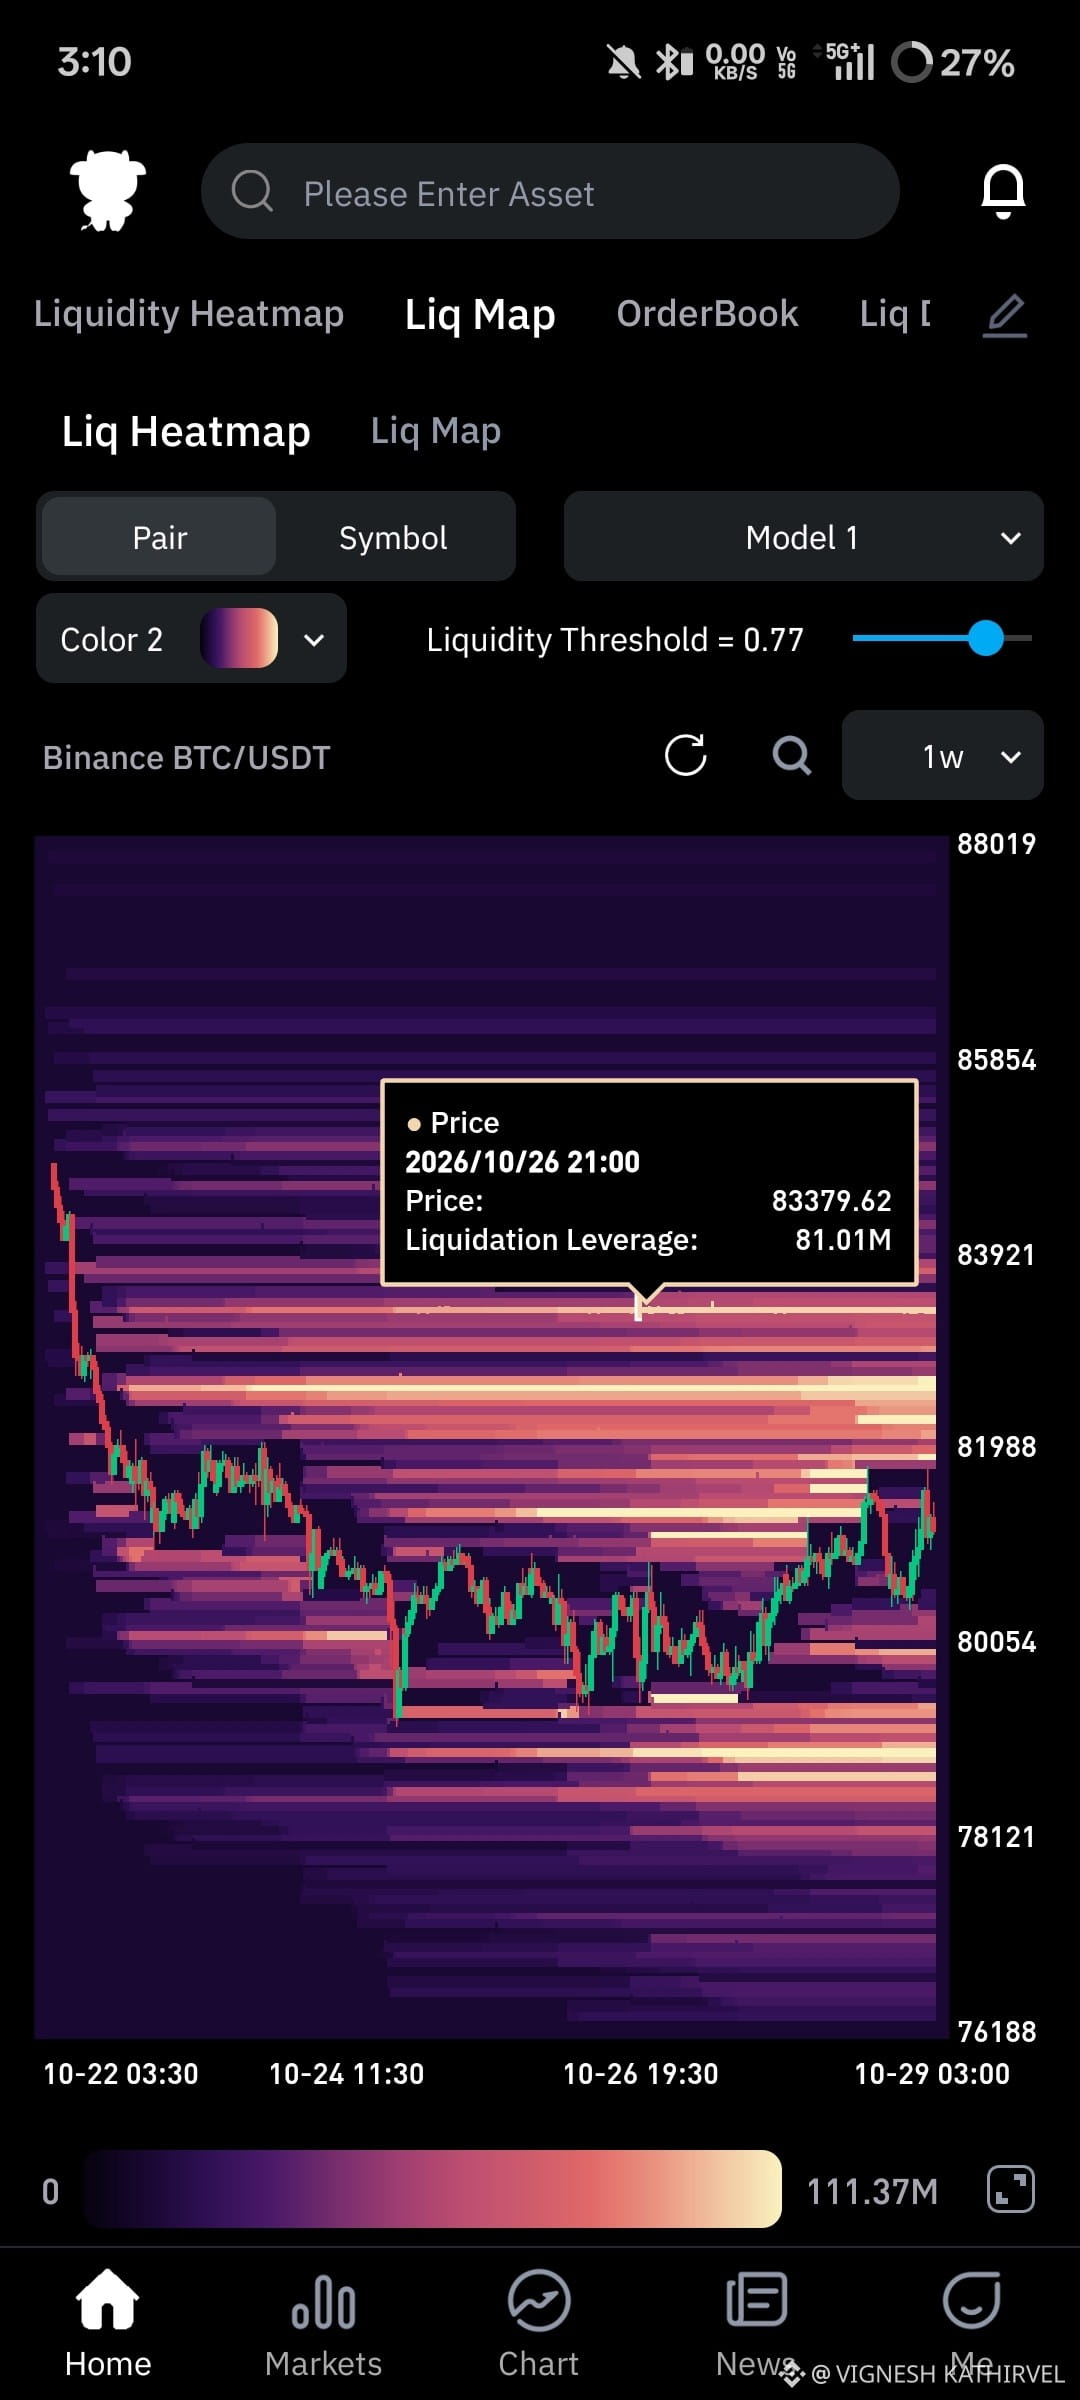
By this chart you can see the liquidity formed at lower on 2 weeks timeframe and both lower and higher at one week timeframe,
which side the liquidity grab first comment below 👇
LIQUIDATION HEATMAP
By this chart you can see the liquidity formed at lower on 2 weeks timeframe and both lower and higher at one week timeframe,
which side the liquidity grab first comment below 👇