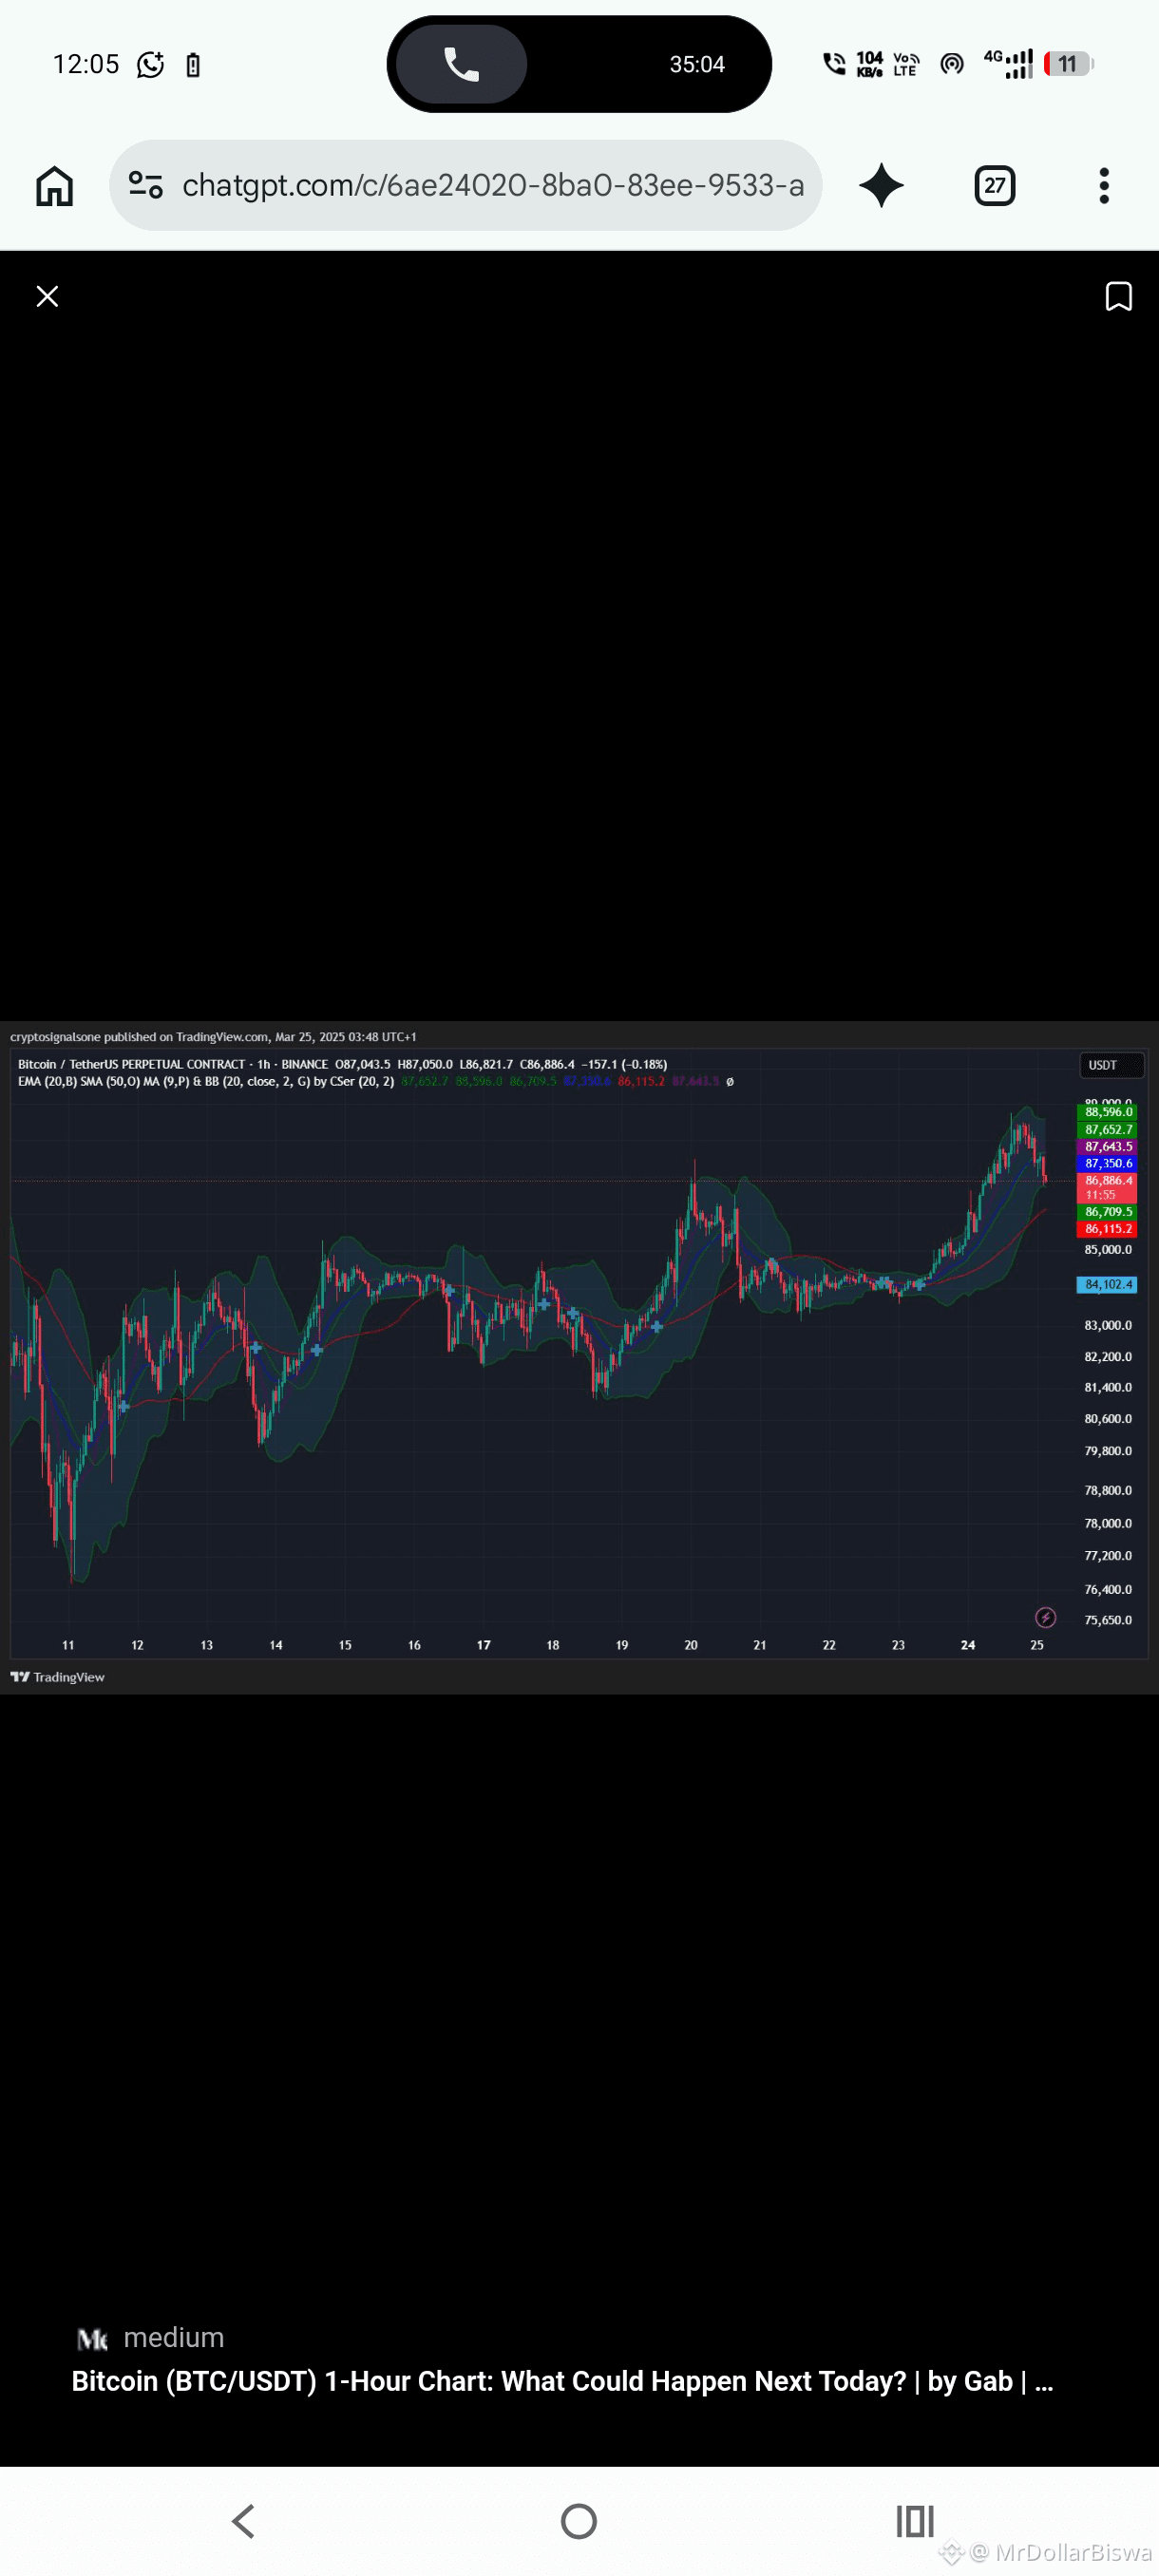
#BTC live chart and technical analysis for BTC/USDT on the 1 hour timeframe.
BTC/USDT – 1-Hour Technical Analysis
Live market monitoring
1H timeframe
For BTC/USDT, the 1-hour chart is useful for identifying short-term trends, breakout opportunities, support and resistance, and potential reversal signals.
Live chart: You can open the interactive Bitcoin chart here:

BTC/USDT – TradingView
Open live 1-hour BTC chart
Select 1H in the chart timeframe menu.
1-hour indicator analysis
The latest structured technical snapshot I could retrieve is from October 28, 2026, 12:07 UTC, so it is not a verified live candle reading.
Indicator
Latest reported value
Signal
EMA 20
$80,981.86
Bullish
EMA 50
$80,664.95
Bullish
EMA 200
$81,058.10
Resistance
RSI (14)
62.7
Positive momentum
MACD
Positive histogram
Bullish
ADX
38.4
Strong trend
Volume
Below average
Caution
Source:

MakeEA+1
Important trading levels
Based on that historical indicator snapshot:
Support: $80,858 and $80,400
Resistance: $81,565 and $81,823
Bullish scenario: A confirmed breakout above $81,823 could support further upside.
Bearish scenario: Losing $80,858 could weaken the short-term structure.
These levels need refreshing against the current chart before trading.
My trading outlook
Short-term bias
Bullish, with caution
The reported RSI and MACD favor buyers, but below-average volume and conflicting market-structure signals mean a breakout is not yet guaranteed.
My recommendation: Wait for a confirmed 1-hour candle close before entering a trade. Always use a stop-loss, especially with leverage.
One question: Would you also like me to prepare a BTC/USDT trading setup with entry price, stop-loss, take-profit 1, take-profit 2, and take-profit 3 for both LONG and SHORT?