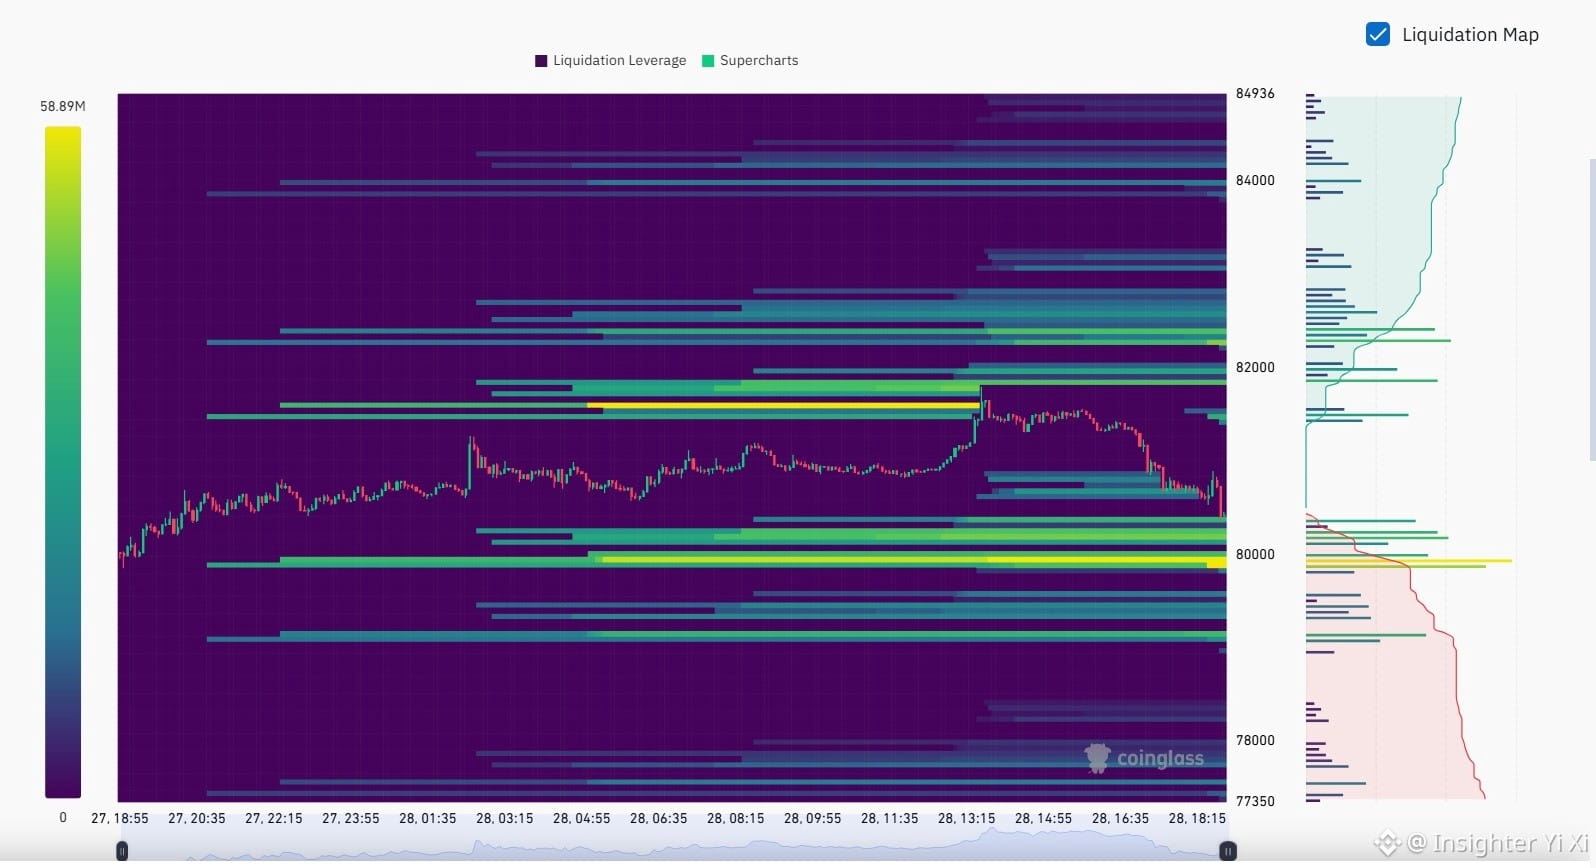

$BTC Liquidation Heatmap Analysis 🧲
Important Liquidity Zones
82,300–82,600 — Upper Liquidity Zone Strong liquidity clusters are visible here. If BTC recovers upward, this zone could become a potential liquidity target.
81,300–81,500 — Major Upper Cluster A bright yellow liquidity band is visible on the heatmap. If price moves into this area, short liquidations could be triggered, depending on market positioning.
79,900–80,100 — Major Lower Liquidity Zone A bright liquidity cluster is visible below the current price area. If BTC breaks its recent low, a move toward this zone is possible.
79,000–79,300 — Lower Liquidity Cluster If selling pressure continues and the $80,000 zone breaks decisively, this could be the next area to watch.#bitcoin