

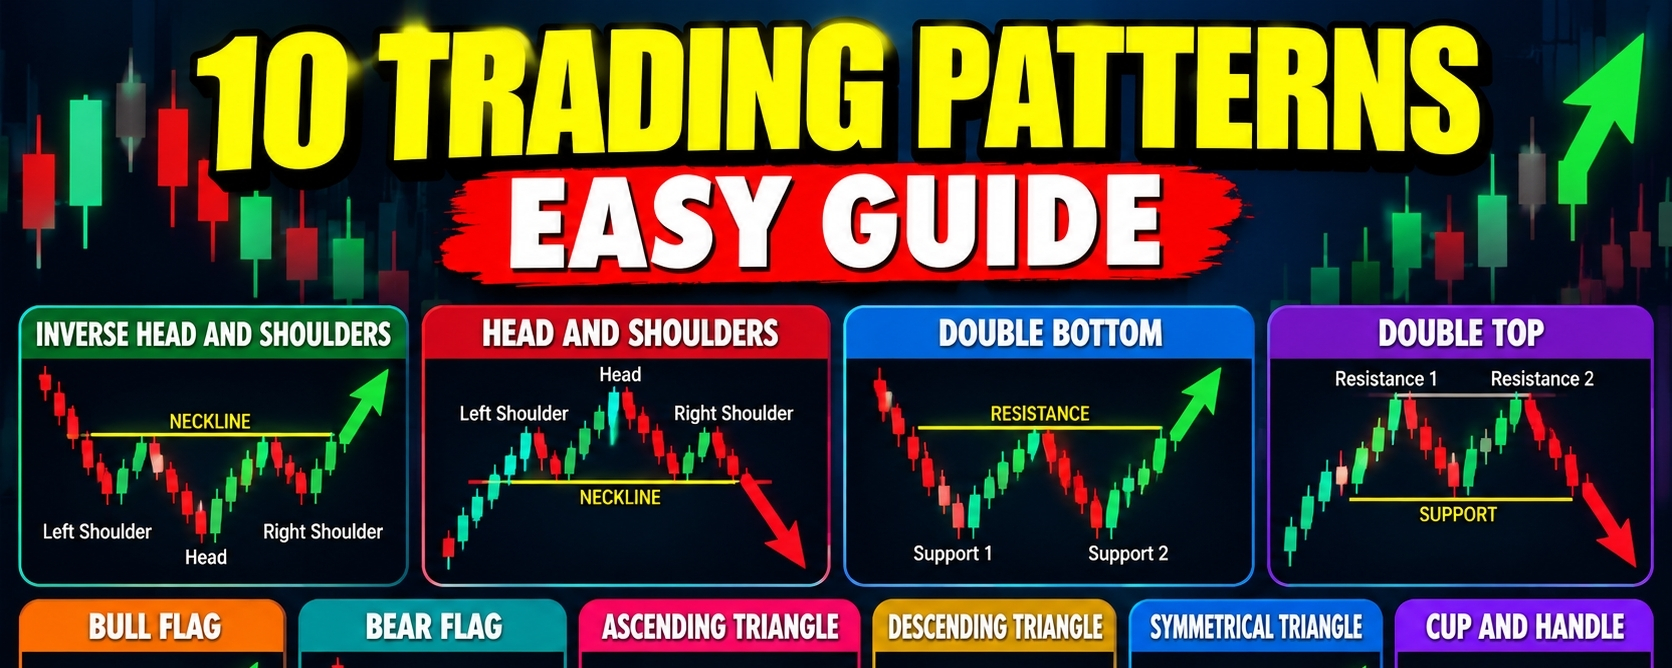

Trading chart patterns are shapes that form when prices move up and down on a chart. Traders study these patterns to understand the possible direction of the market. Some patterns suggest that a trend may reverse while others suggest that the existing trend may continue. However these patterns do not guarantee future price movements.
1. Inverse Head and Shoulders.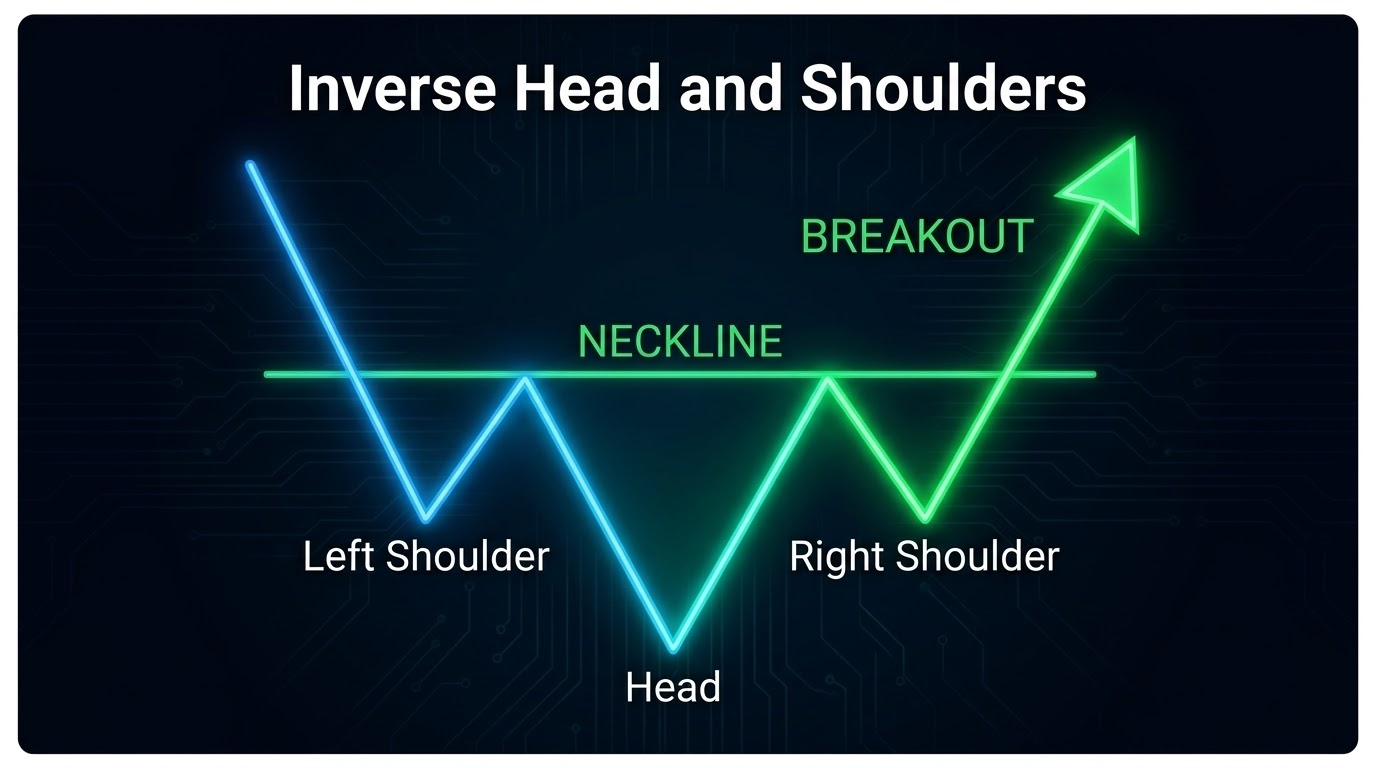
The inverse head and shoulders is a bullish reversal pattern that can appear after a downtrend. It contains three lows. The middle low is the deepest and is called the head. The two outer lows are called the shoulders. A neckline connects the highs between these lows. When the price breaks above the neckline the pattern may indicate that buyers are gaining control and an upward move could begin.
2. Head and Shoulders.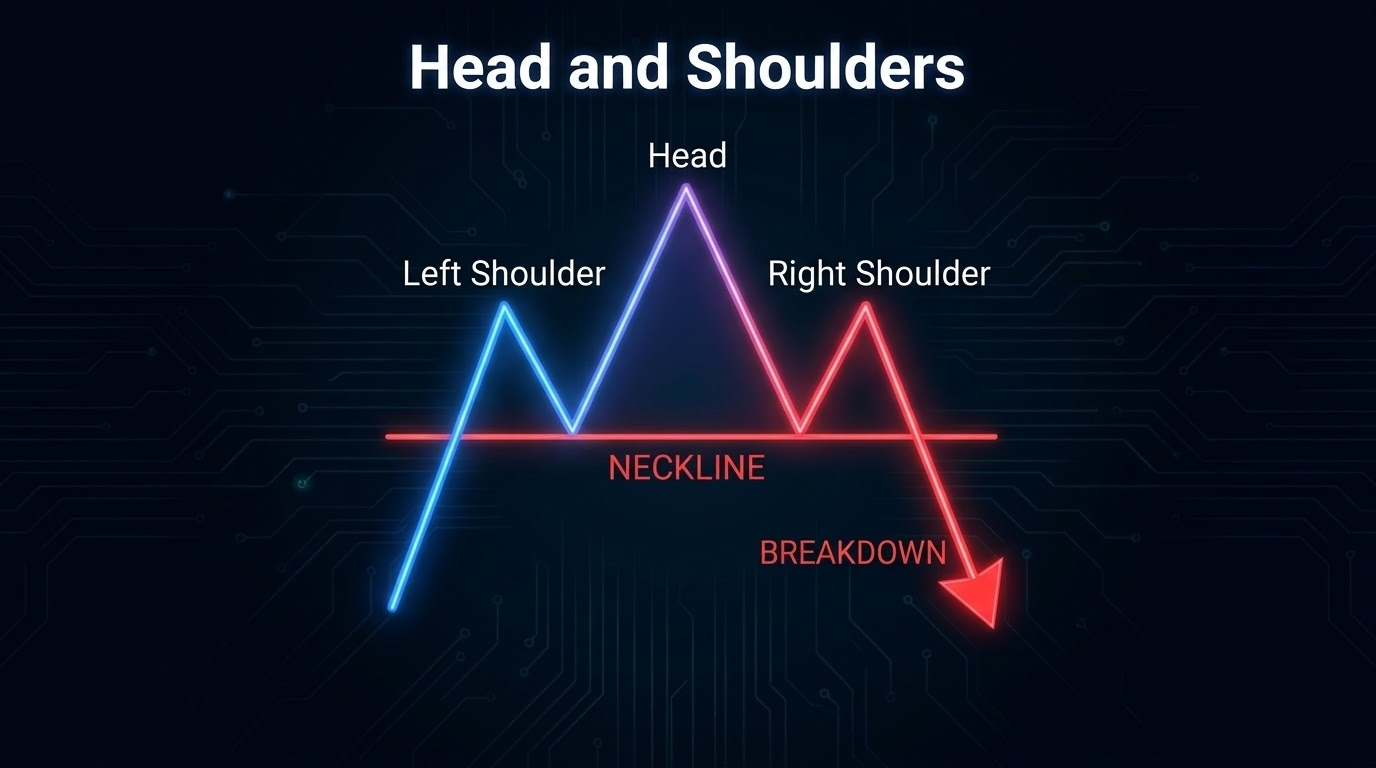
The head and shoulders pattern is a bearish reversal pattern that often appears after an uptrend. It contains three peaks. The middle peak is the highest and is called the head. The two outer peaks are the shoulders. A neckline connects the lows between the peaks. When the price breaks below the neckline the pattern may indicate that buying pressure is weakening and the market could move downward.
3. Double Bottom.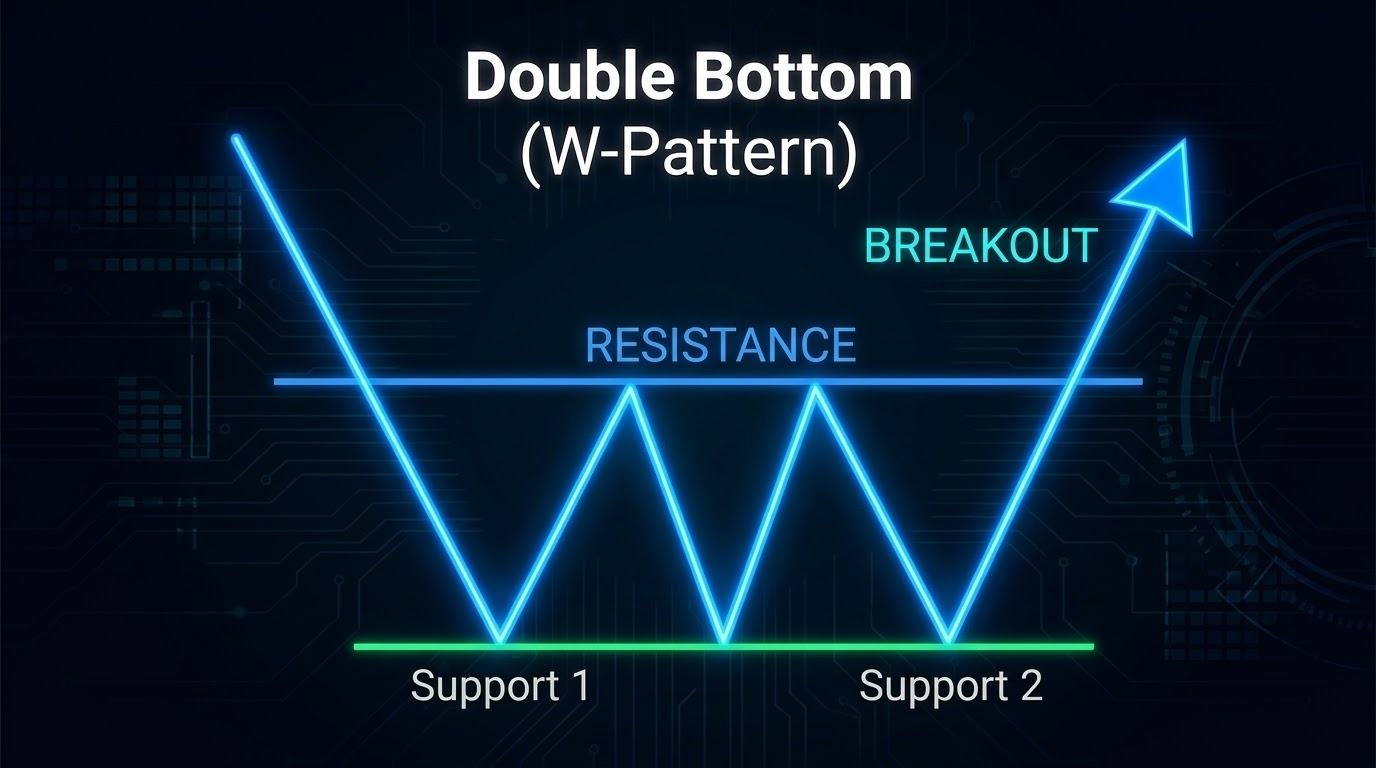
The double bottom is a bullish reversal pattern that looks like the letter W. It forms when the price falls to a similar support area twice and rises after each attempt. This suggests that sellers are struggling to push the price lower. The pattern becomes more meaningful when the price breaks above the resistance level formed between the two lows. This breakout may signal the beginning of an upward move.
4. Double Top.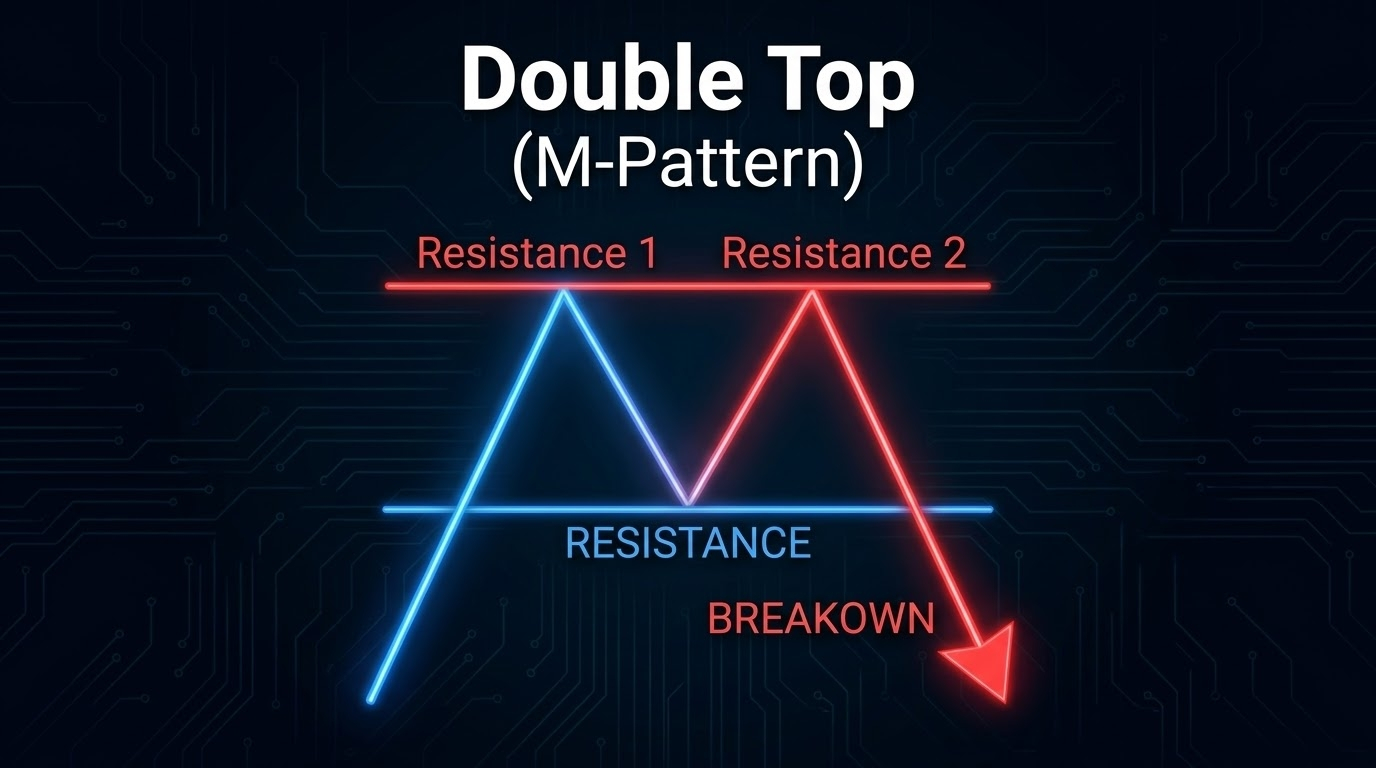
The double top is a bearish reversal pattern that looks like the letter M. It forms when the price reaches a similar resistance area twice and falls after each attempt. This suggests that buyers are struggling to push the price higher. The pattern is confirmed when the price breaks below the support level between the two peaks. This breakdown may indicate the beginning of a downward move.
5. Bull Flag.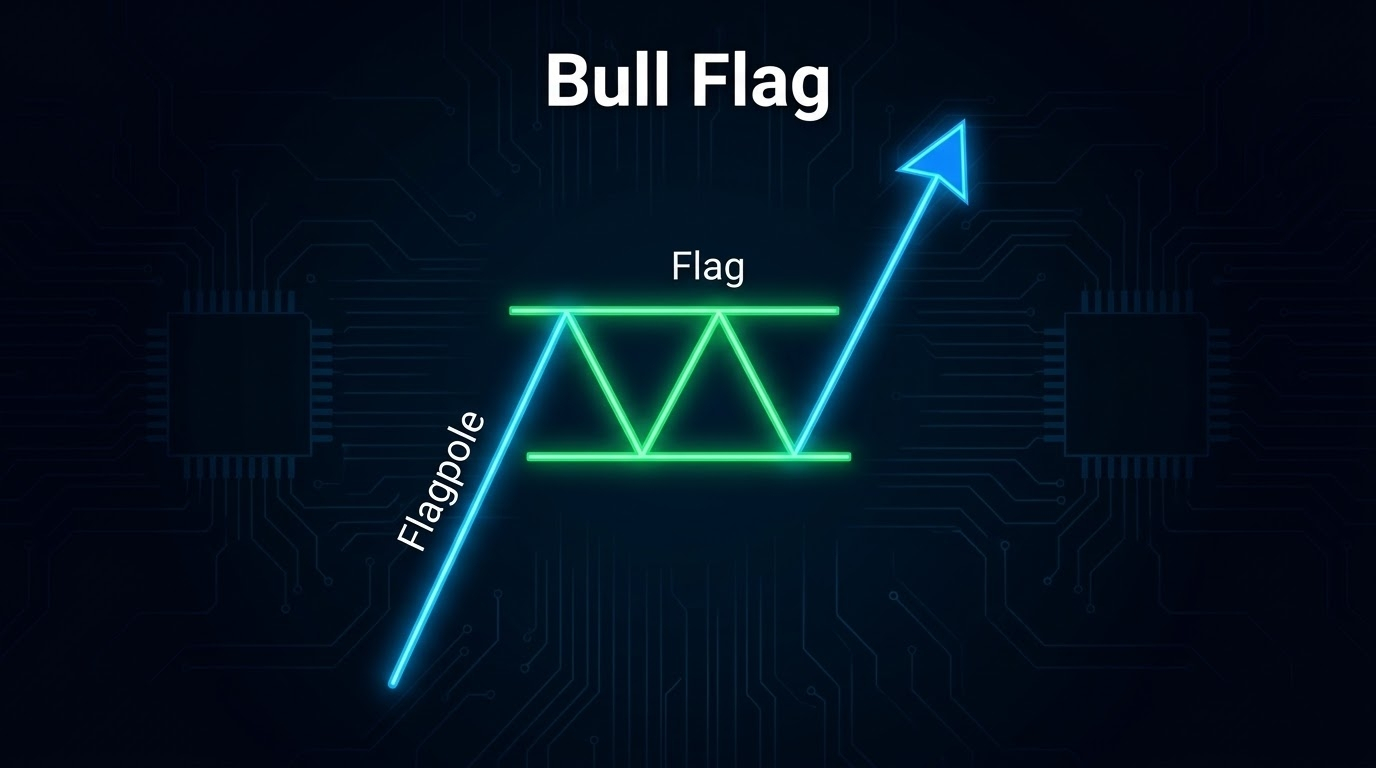
The bull flag is a bullish continuation pattern that usually forms after a strong upward price movement. The sharp rise creates the flagpole. A short period of consolidation forms the flag as the price moves sideways or slightly downward. When the price breaks above the flag the previous upward trend may continue. Traders often look for this pattern when a strong rally pauses before potentially moving higher again.
6. Bear Flag.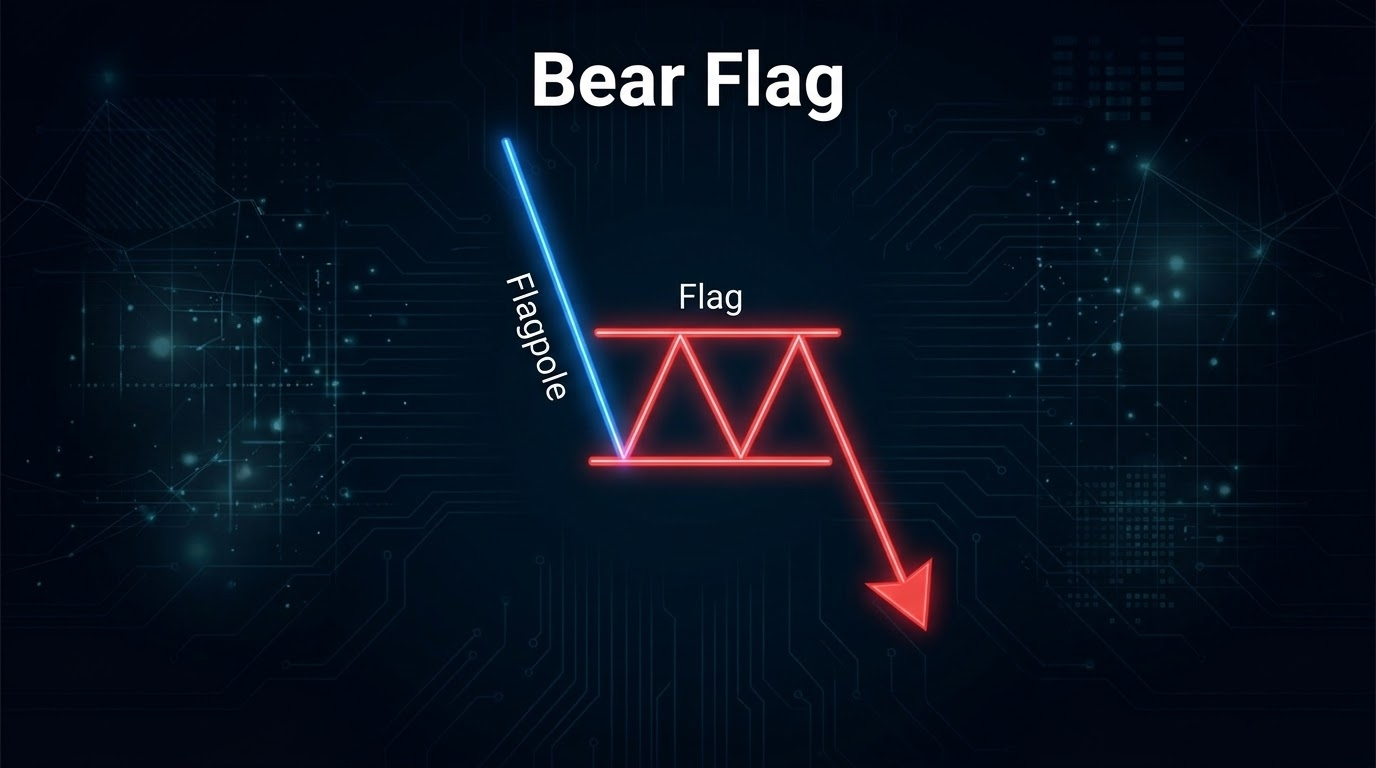
The bear flag is a bearish continuation pattern that usually forms after a strong downward price movement. The sharp decline creates the flagpole. A short recovery or sideways movement forms the flag. When the price breaks below the flag the previous downward trend may continue. Traders watch this pattern because a temporary recovery does not always mean that the market has changed direction.
7. Ascending Triangle.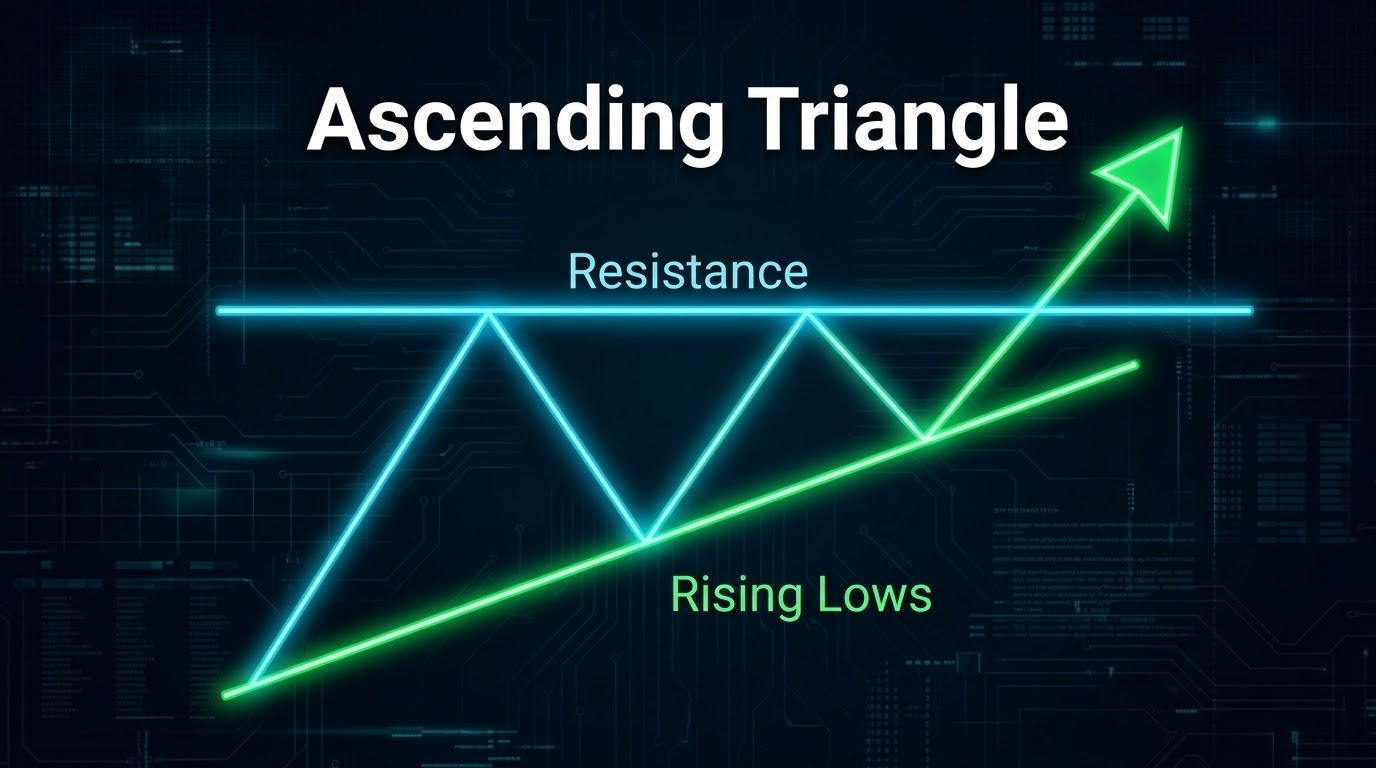
The ascending triangle is a pattern with a relatively flat resistance level and rising support levels. The price repeatedly approaches the same resistance area while each pullback stops at a higher level. This suggests that buyers are gradually pushing the price upward. A breakout above resistance may signal a bullish move. However the price can also fail to break resistance and move downward instead.
8. Descending Triangle.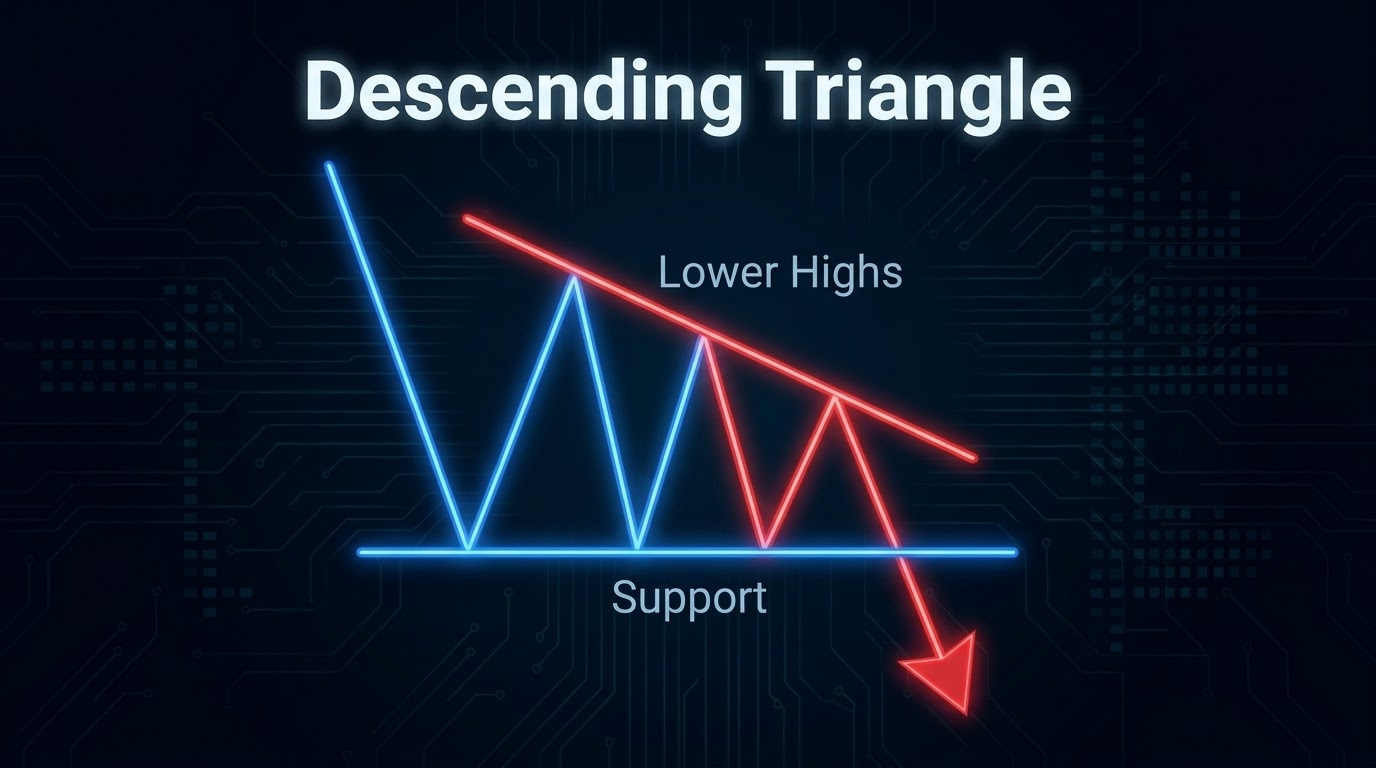
The descending triangle is a pattern with a relatively flat support level and falling resistance levels. The price repeatedly approaches the same support area while each recovery reaches a lower high. This suggests that sellers are applying increasing pressure. A breakdown below support may signal a bearish move. However the support level can hold and the price may break upward instead.
9. Symmetrical Triangle.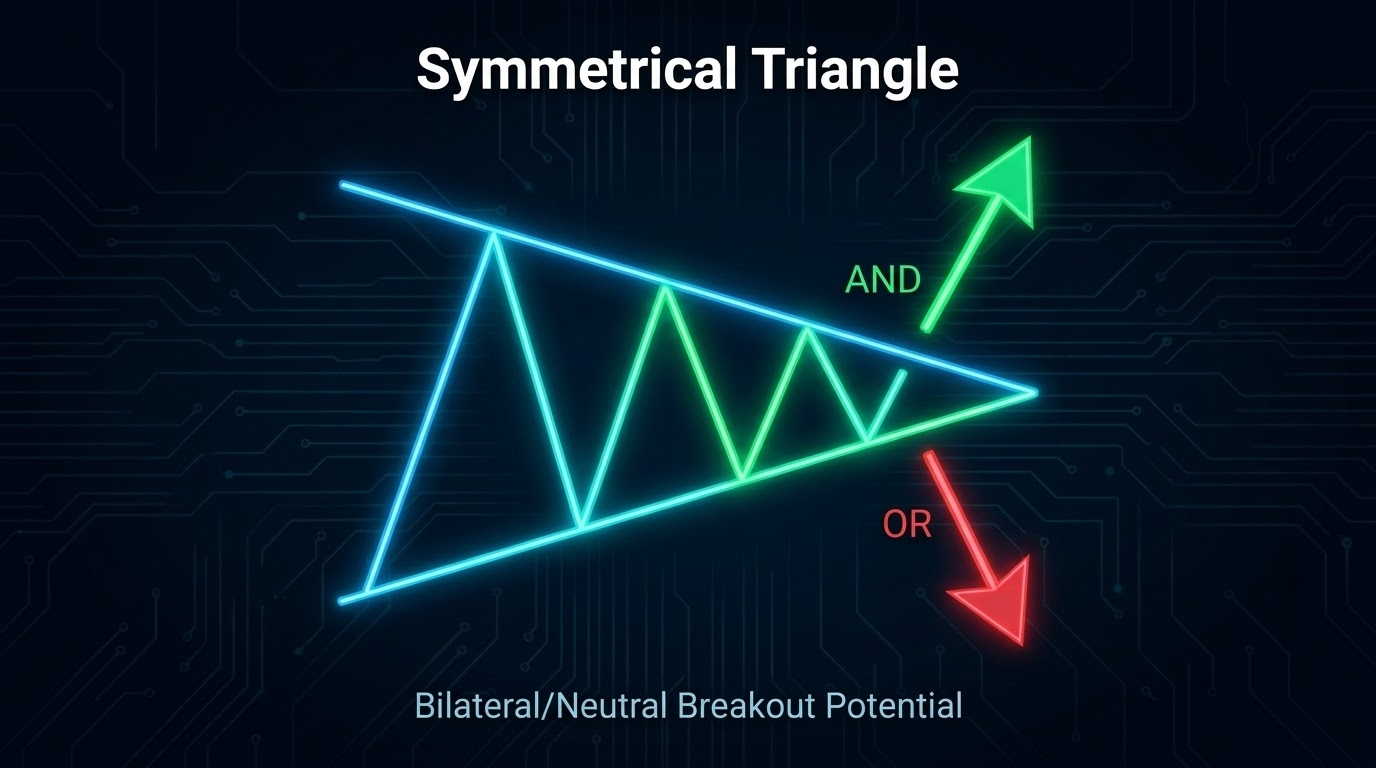
The symmetrical triangle forms when the price creates lower highs and higher lows. These movements bring the resistance and support lines closer together. This shows that the trading range is narrowing as buyers and sellers compete for control. The pattern does not provide a reliable direction before a breakout. A move above resistance may signal an upward move while a break below support may signal a downward move.
10. Cup and Handle.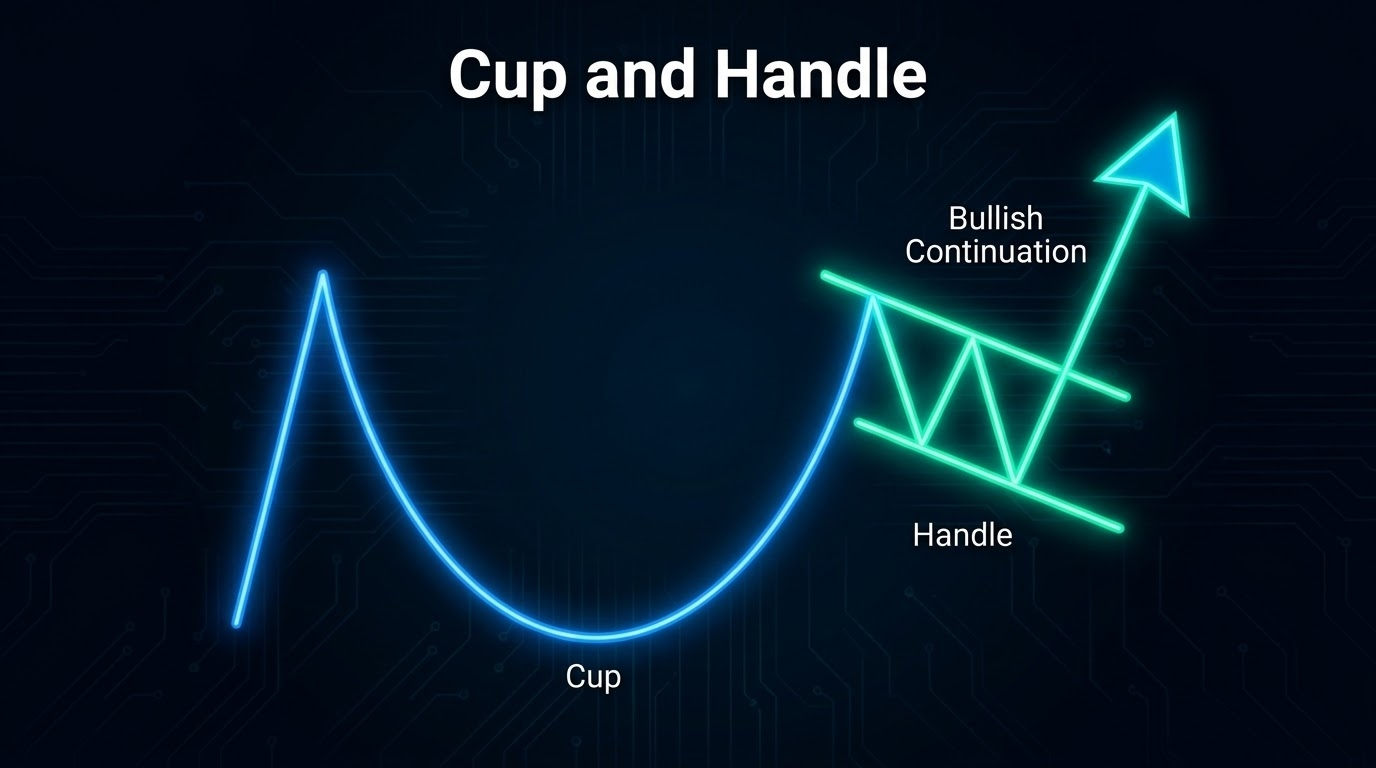
The cup and handle is generally considered a bullish continuation pattern. The cup forms when the price declines and then gradually recovers to create a rounded shape. The handle forms when the price experiences a smaller pullback or sideways movement near the previous resistance area. A breakout above the handle resistance may indicate that the upward trend is resuming. A deep or prolonged decline in the handle can weaken the pattern.
Trading chart patterns can help us identify possible market reversals and trend continuations. The inverse head and shoulders and double bottom may indicate bullish reversals. The head and shoulders and double top may indicate bearish reversals. Bull flags and bear flags often suggest that an existing trend may continue. Triangles show a narrowing trading range while the cup and handle can indicate a potential continuation of an upward trend.
A pattern should not be treated as a guaranteed signal. We are generally look for a confirmed breakout and consider the broader trend and trading volume before making a decision. Risk management remains important because even well formed chart patterns can fail.