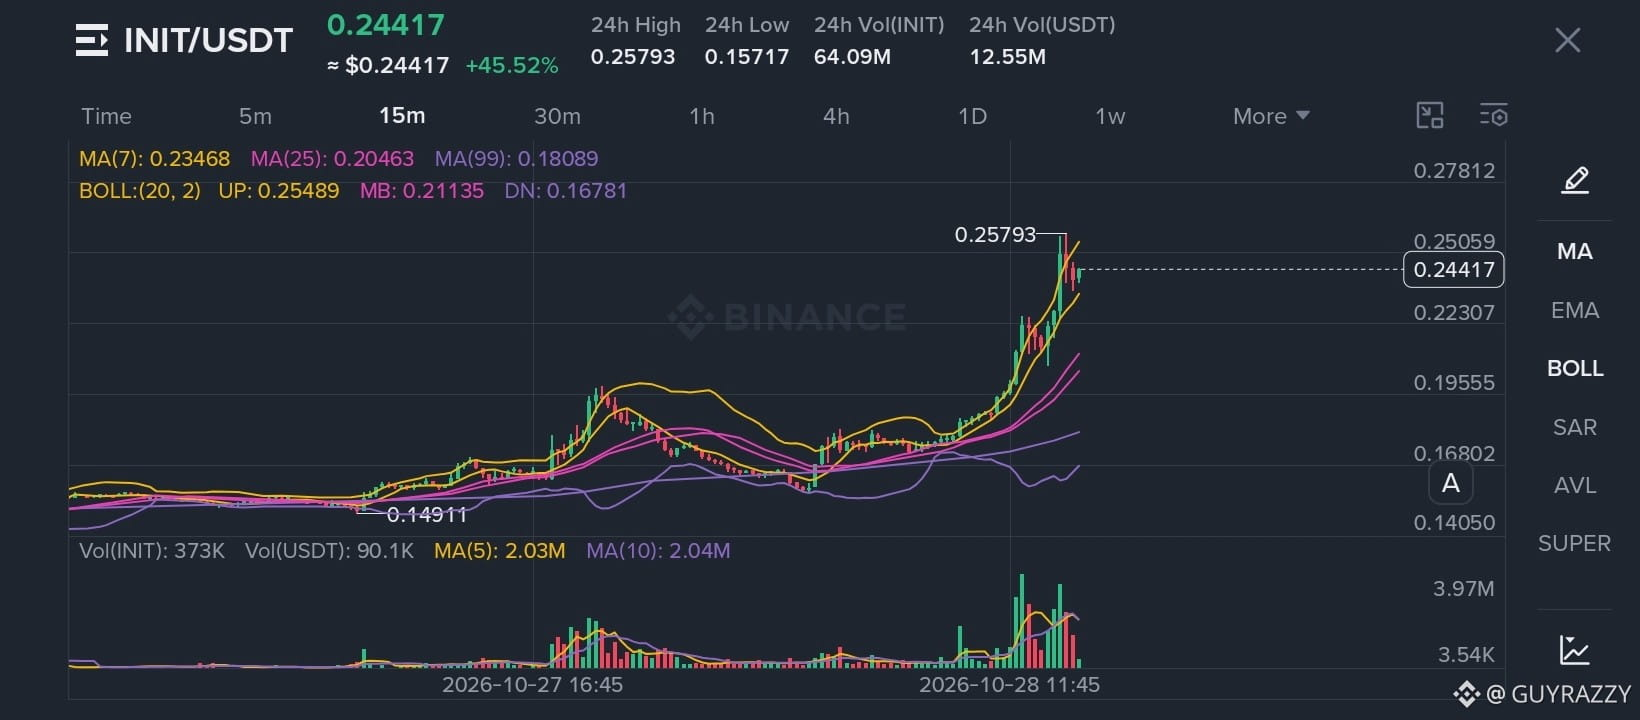
INIT Has Exploded Higher, Can Bulls Push Through $0.258?
I’m watching the $0.258 resistance closely. $INIT has delivered a powerful rally, but after such an aggressive move, the next reaction will determine whether buyers can extend the run or sellers force a deeper correction.
Market Outlook
15M View
Trend: Strongly bullish. Price is trading above MA(7) at 0.23468, MA(25) at 0.20463, and MA(99) at 0.18089.
Recent Price Action: INIT climbed from the $0.16–$0.18 region toward a high of $0.25793, then pulled back to $0.24417.
Buyer vs. Seller Control: Buyers dominate the structure, although the rejection near the high signals increasing short-term selling pressure.
Market Overview
Sentiment: Aggressively bullish, with elevated pullback risk.
Relative Performance: INIT is up 45.52% over 24 hours, with visible expansion in trading activity.
Technical Analysis
> Price Action: Price remains above its key moving averages.
> Volume: The rally came with substantial volume spikes; sustained buying is needed for continuation.
> Momentum: Strong, but the latest pullback suggests cooling momentum.
> Resistance: $0.25059, then $0.25793.
> Support: $0.23468, followed by $0.22307.
Trading Plan
Long: Look for support to hold and a confirmed reclaim of $0.25059. A breakout above $0.25793 could open further upside. Stop below confirmed support.
Short: Consider only after a confirmed break below $0.23468 and a failed retest, targeting $0.22307. Stop above the retest high.
Bottom Line
> Direction: Bullish.
> Best Setup: Breakout confirmation or a controlled pullback.
> Continuation vs. Reversal: Continuation remains favored while support holds; losing it increases correction risk.
Next step: Watch how the 15M candle closes around $0.25059 before committing to a breakout trade.
#EarningsSeason $AAPLB