

LINK Analysis: A Potential Second Leg Toward $12.30?
Let's take a look at the analysis of LINK. 👇
First, Bitcoin has pumped above the $81,000 level and managed to close multiple candles above it. This suggests that the market direction is currently bullish. Meanwhile, BTC dominance is ranging, and when I checked the LINK/BTC chart, I noticed that LINK was printing bullish candles. This makes LINK/USDT an interesting pair to watch.
📊 Key Support & Trading Setup
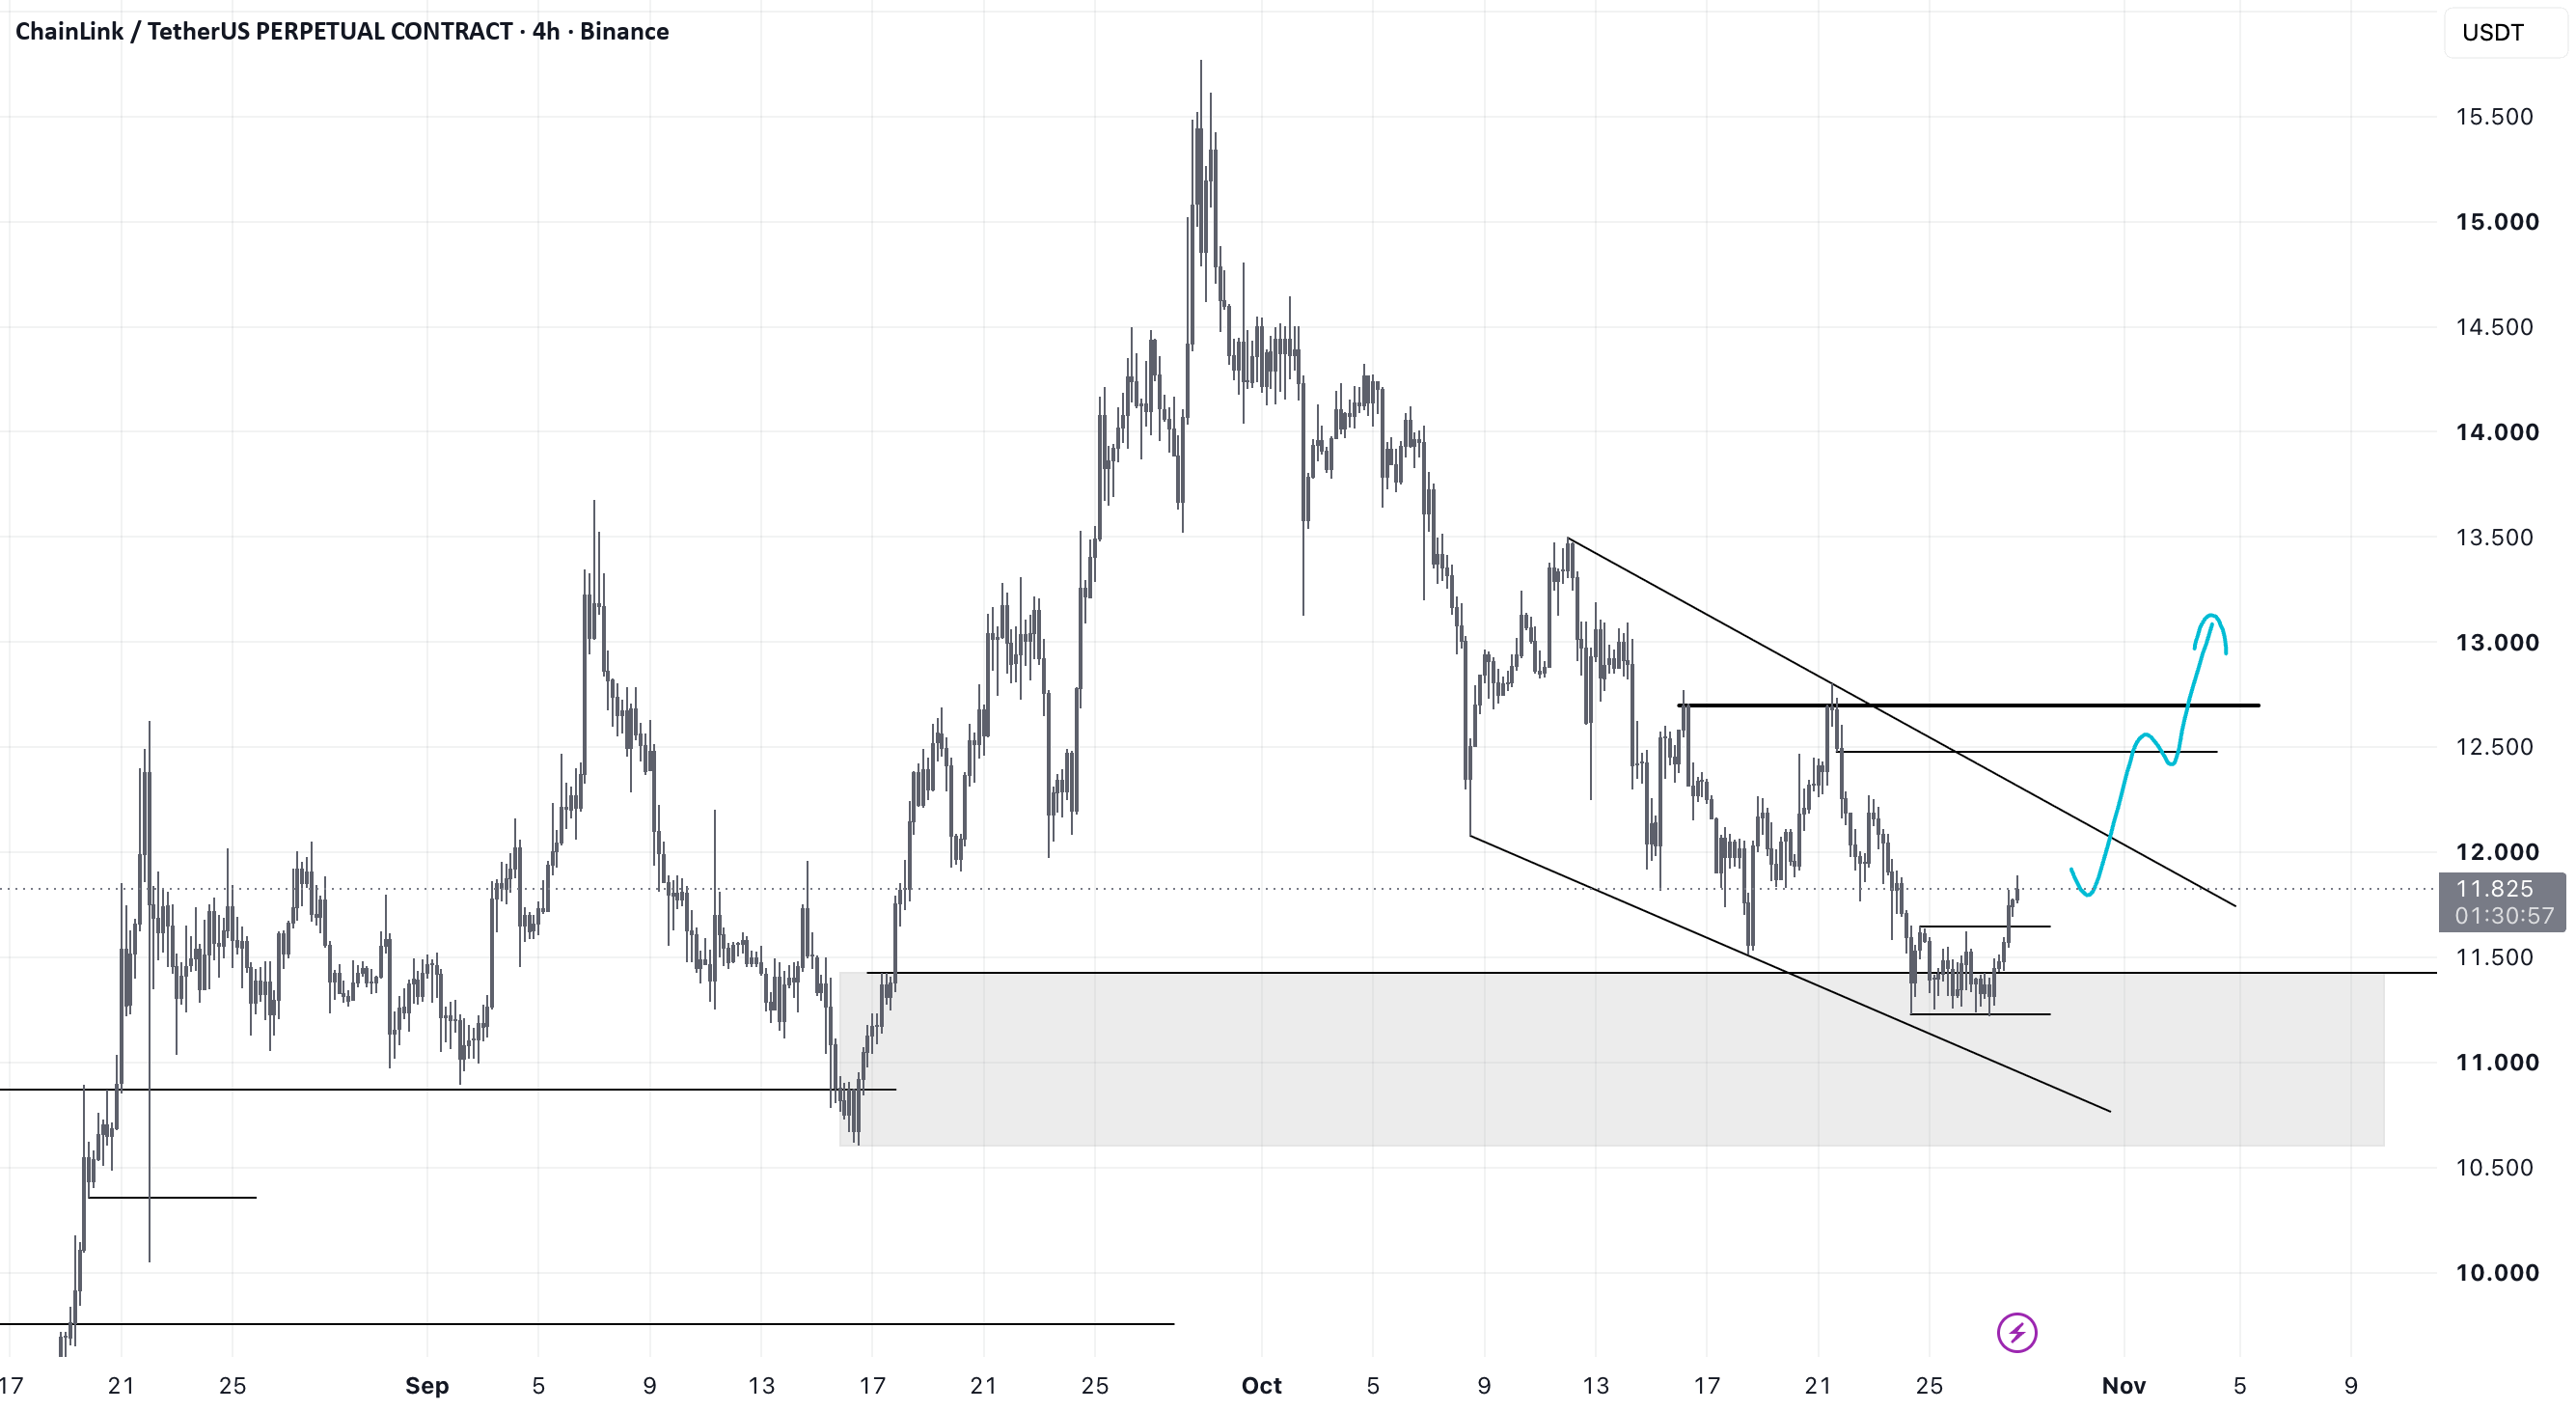
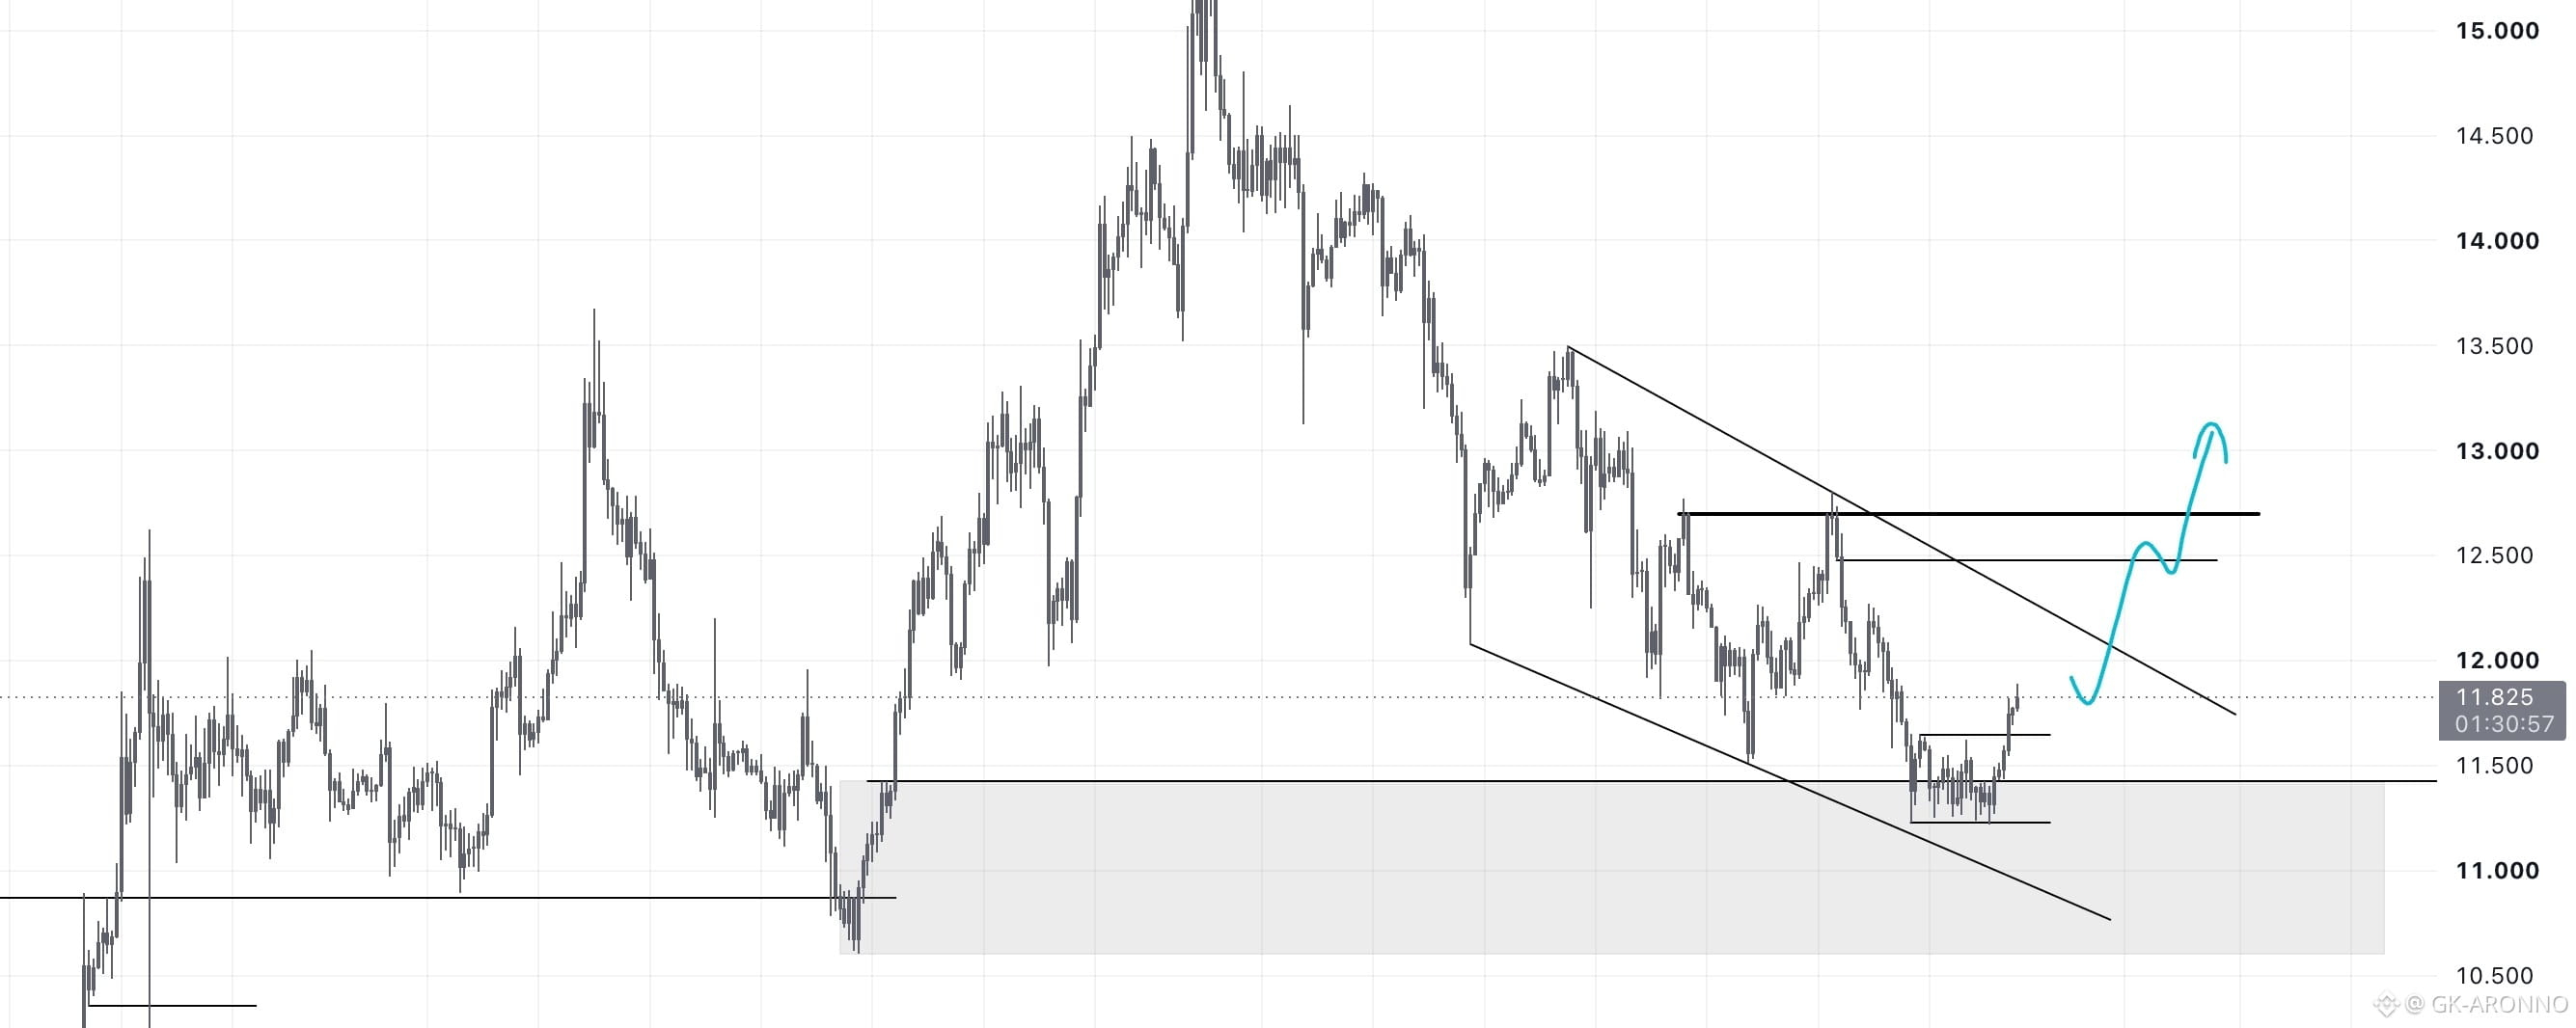
LINK has a major support zone between $11.00 and $11.50. After reaching this area, the price formed a trading range between $11.20 and $11.60.
The price has now broken above the top of this range, which could create an opportunity to catch the second leg of the pump toward $12.30.
Based on your own trading strategy, you can look for potential buy setups on LINK/USDT.
⚠️ Important Resistance
If you pay attention to the chart, you'll also notice a significant resistance level around $12.70. If LINK breaks above this level, we could see further upside toward higher price levels.
❌ Invalidation Level: $11.20