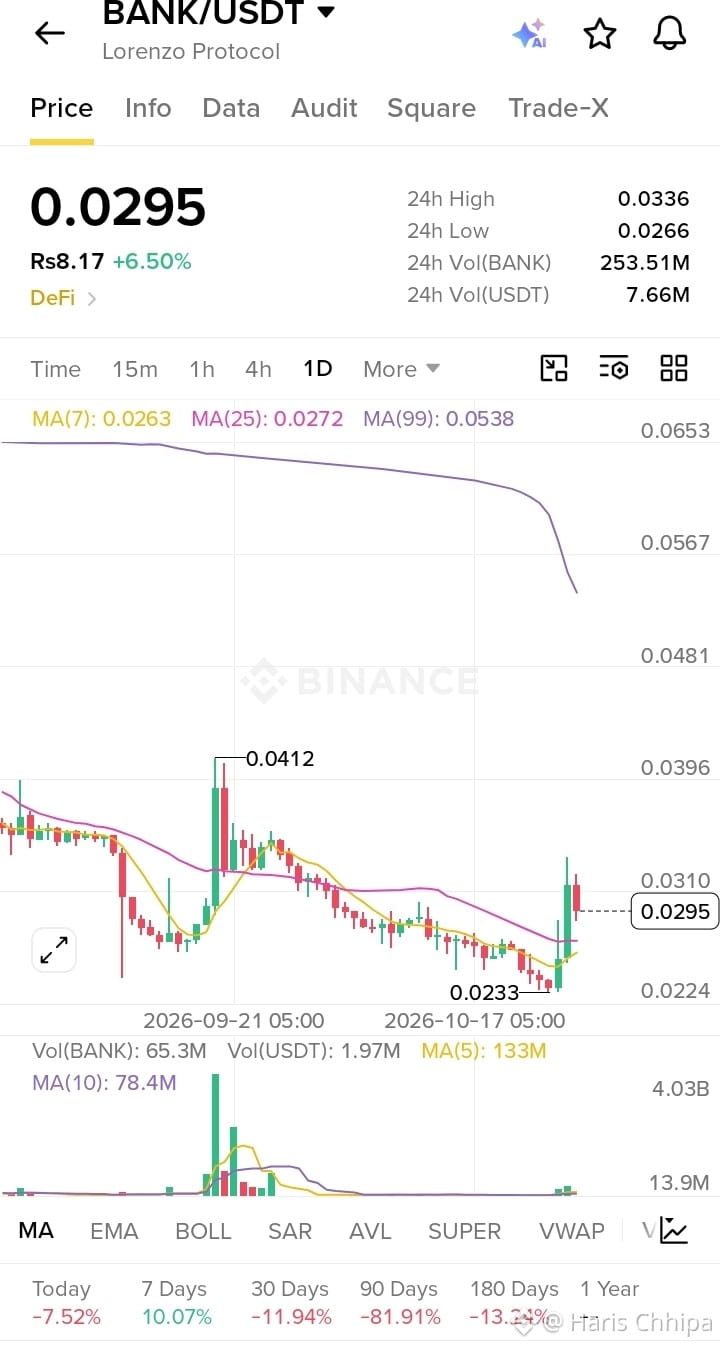
BANK/USDT — 4-hour Spot MACD Analysis
This reading uses the MACD on the BANK/USDT spot 4-hour chart, based on 6 completed candles. The latest returned candle is still provisional and is not used for the main signal.
Signal state
MACD: 0.00135333
MACD Signal: 0.00085737
MACD Histogram: 0.00049596
The MACD is still above the signal line, and the histogram remains positive, so momentum is currently bullish in MACD terms. However, momentum is weakening:
MACD rose from 0.00055178 to a recent high of 0.00139855, then eased to 0.00135333.
The histogram peaked at 0.00076701 and narrowed to 0.00049596.
This shows that bullish momentum is still present but losing strength after the price pullback.
Supporting chart evidence
Across the 6 completed 4-hour candles:
Price moved from 0.02750000 to 0.02900000.
It reached a high of 0.03150000 before pulling back.
The latest completed candle opened at 0.03010000, reached 0.03010000, fell to 0.02870000, and closed at 0.02900000.
Quote volume decreased from 976391.35442000 initially to 711668.32697000 on the latest completed candle, after reaching a maximum of 1796501.62692000.
The price structure confirms a strong upward move followed by a pullback, while the positive MACD spread indicates that the broader 4-hour momentum has not yet fully reversed. The latest provisional candle is around 0.02940000, but it should not be treated as confirmed until it closes.
Invalidation or reversal conditions
The current MACD state would weaken or become invalid if:
MACD falls to or below the Signal line, currently 0.00085737.
MACD Histogram turns negative, meaning the MACD crosses below the Signal line.
A stronger reversal signal would occur if MACD itself falls below zero.
This is an indicator reading, not a buy or sell recommendation. MACD can lag, especially during sharp moves in lower-liquidity tokens.
BANK #BANKUSDT #MACD #TechnicalAnalysis #CryptoAnalysis #SpotTrading $BANK