$BMT Perp Update: Sellers in Control, Key Support at $0.0266 Under Pressure 📉
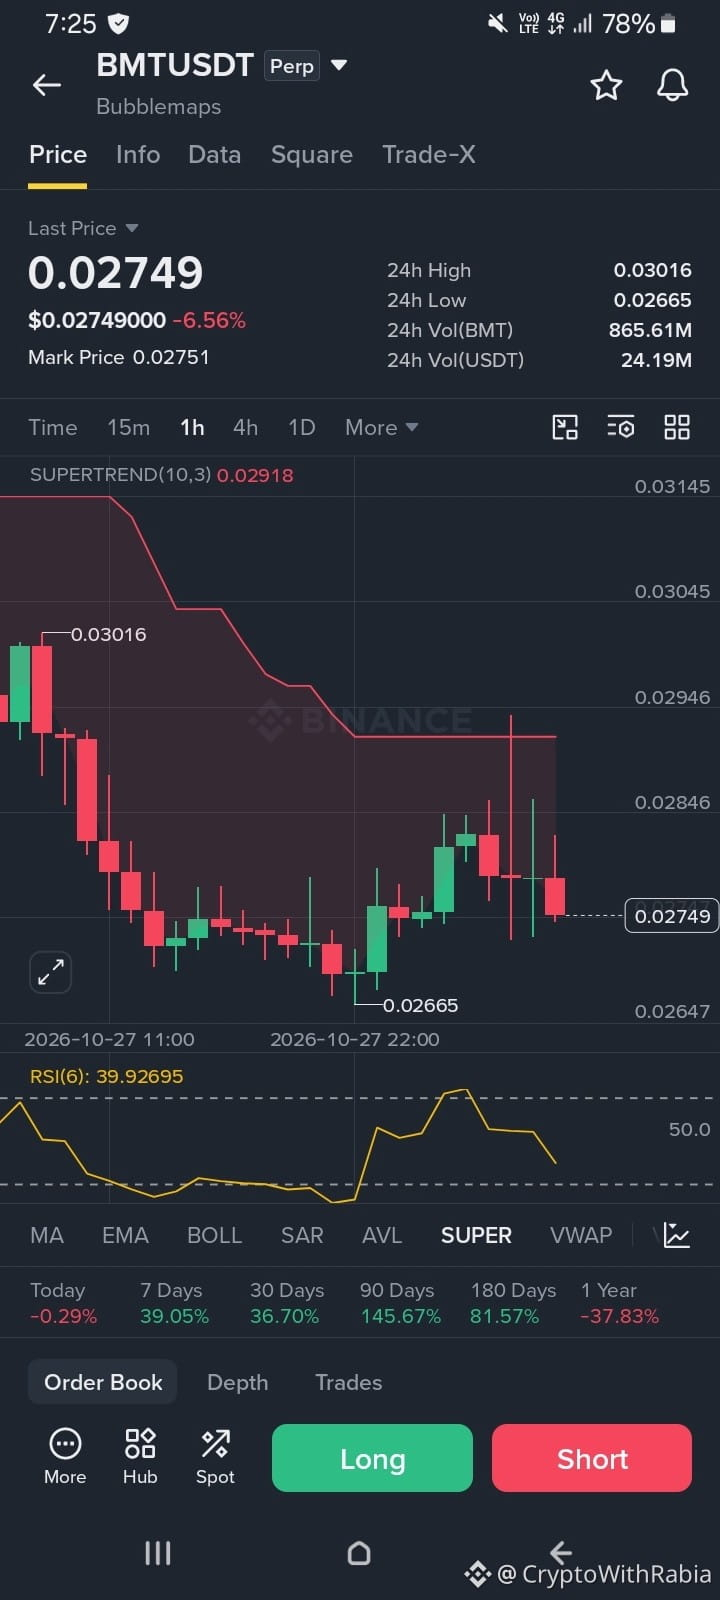
Bubblemaps (BMTUSDT Perp) is trading around $0.02749, down -6.56% in the last 24 hours. The 24h range is $0.02665 to $0.03016, with volume of about $24.19M USDT.
Short-term view (1h chart):
• Price bounced from $0.02665 but was rejected hard near $0.0285, leaving a long upper wick
• Supertrend is bearish at $0.02918, acting as strong overhead resistance
• RSI(6) is at 39.9, leaning bearish and still turning down
• Resistance: $0.02846, then $0.02918 and $0.02946
• Support: $0.02665, then $0.02647
Bigger picture:
• Today: -0.29%
• 7 Days: +39.05%
• 30 Days: +36.70%
• 90 Days: +145.67%
• 180 Days: +81.57%
• 1 Year: -37.83%
BMT is cooling off after a huge multi-month run. The bounce failed to reclaim the Supertrend line, and lower highs are forming. As long as price stays below $0.0292, rallies can face selling pressure. The $0.0266 zone is the line in the sand.
📊 Trade Plan (Example Only):
Short (breakdown play):
• Entry: Below $0.02660 with a 1h candle close
• Stop Loss: $0.02760
• TP1: $0.02580
• TP2: $0.02500
• Risk-Reward: approx. 1:2
Long (support bounce):
• Entry: $0.02665 - $0.02700 (confirm with a green 1h candle)
• Stop Loss: $0.02620
• TP1: $0.02846
• TP2: $0.02918
Invalidation: For shorts, a 1h close above $0.02918 cancels the bearish view. For longs, a close below $0.02665 means the bounce has failed.
After a 100%+ quarterly move, volatility is high. Wait for a candle close, use small position size, and keep leverage low on futures.
Will BMT hold $0.0266 or break lower? Share your view below! 👇
Not financial advice. Always DYOR. Futures trading carries high risk.
#BMT #TradingSignals #TechnicalAnalysis #cryptotrading #BinanceSquare
$HAEDAL
$HUMA