


Silver’s retreat toward $52 has extended a painful decline, and several analysts believe the metal may still have further to fall. Their charts leave room for another setback before the larger recovery they anticipate can begin.
The latest weakness follows approximately 9 weeks of declines within a broader retreat from a peak near $121. That puts silver roughly 57% below that high, although a large loss alone does not establish that a bottom is close.
Shitij Kapoor, Investing Angles, and Crypto Patel have identified different areas where the decline could eventually settle. Their assessments share a common theme: silver’s longer recovery story could include considerably more pain first.
Shitij Kapoor Places Silver’s Potential Bottom Near $37 to $39
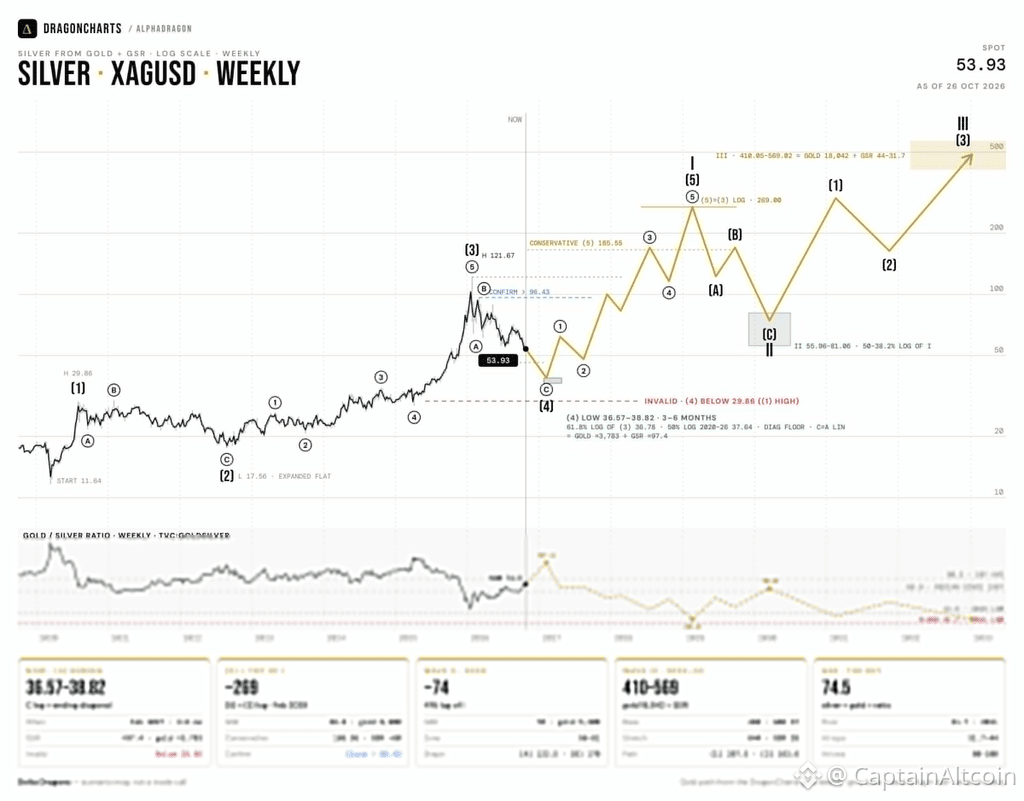
Shitij Kapoor expects silver’s correction to find a possible bottom around $37 to $39 in February 2027.
His reasoning centers on the overlap of 3 Elliott wave and Fibonacci levels between $36.57 and $38.82. That overlap makes the area important within his analysis because several separate measurements point toward a similar price zone.
 @KapoorShitij / X
Elliott wave analysis interprets market advances and corrections as parts of a broader sequence. Fibonacci measurements help analysts estimate where those movements might end. Agreement between those methods can strengthen a technical case, although it cannot guarantee that support will hold.
Silver would need to fall approximately 25% to 29% from $52 to reach Kapoor’s rounded bottom range. His outlook therefore allows for a meaningful additional decline before the proposed recovery begins.
The crucial distinction is that Kapoor describes his work as a roadmap, not a fixed forecast. He explicitly notes that the levels can change as new weekly candles close.
Kapoor’s Silver Rally Roadmap Includes Another Large Correction
Kapoor’s bullish case extends well beyond the proposed February 2027 bottom. His sequence points toward approximately $269 by early 2029, which he identifies as the top of the first major cycle.
That advance would then give way to another substantial correction. His roadmap places a possible pullback near $74 in 2030 before a further rally develops.
The final stage targets approximately $410 to $569 during 2032 and 2033. However, those projections depend on major assumptions about gold and silver’s relative valuation.
His stated conditions include:
Gold would need to reach approximately $18,000.
The gold-to-silver ratio would need to decline into the 30s or 40s.
Silver would need to remain above his $29.86 invalidation level.
The ratio measures how many ounces of silver equal the price of 1 ounce of gold. A lower ratio means silver has become more valuable relative to gold.
Those conditions make the ambitious targets conditional. A break below $29.86 would invalidate Kapoor’s current wave count and require a fresh assessment.
Investing Angles Questions Whether Silver Can Stabilize Inside $42 to $58
Investing Angles focuses on a broader downside zone that silver has already reached.
The account’s commentary describes a fall from roughly $120 to $54. It states that its annual analysis had identified a possible return toward $42 to $58 after an initial extension higher.
Silver near $52 remains inside that range. The immediate question is whether this area can slow the decline and establish a base, or whether the metal will continue through it.
A target zone being reached does not automatically confirm a reversal. Price still needs to demonstrate that selling pressure has eased through sustained stabilization or a recovery.
Investing Angles also leaves room for a deeper extension toward $25. That possibility separates its assessment from a simple call that silver has already fallen enough.
The $42 boundary therefore matters within this framework. A sustained move below it would weaken the case for stabilization inside the identified range and make the deeper scenario more relevant.
Crypto Patel’s Silver Chart Maps a Deeper $28 to $35 Zone
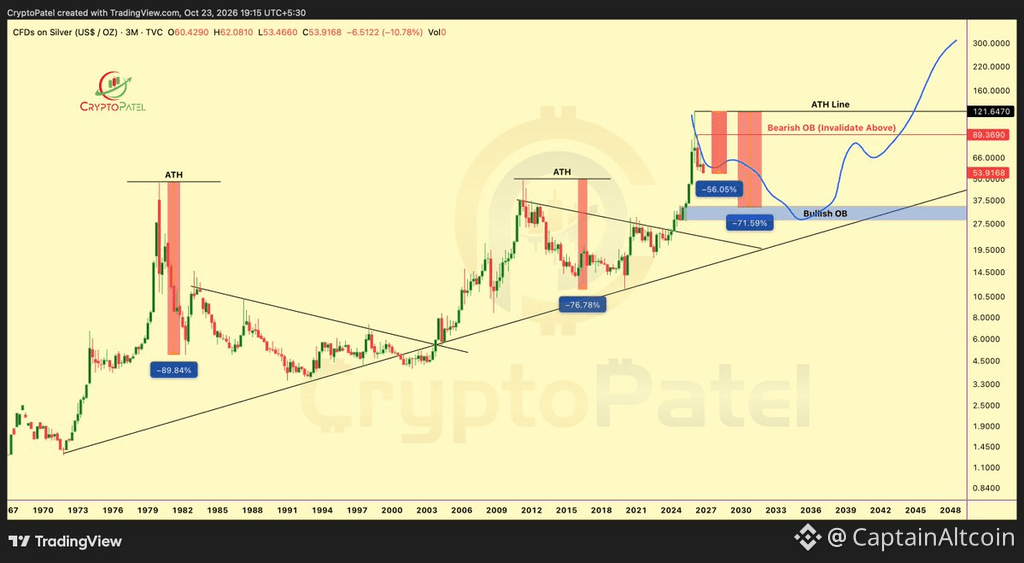
Crypto Patel describes the decline as approximately 56% from silver’s peak and maintains a preferred accumulation zone between $28 and $35.
A look at the silver chart shows that this zone corresponds with the blue area labeled “Bullish OB.” The abbreviation refers to a bullish order block, which the analyst treats as a potential demand area.
His chart uses 3-month candles and spans several decades. That makes it a broad cycle assessment rather than a precise guide to the next few trading sessions.
 https://x.com/CryptoPatel
The chart also contains a rising support line that connects major historical lows. Patel places the blue demand zone above that line, within a wider structure that continues upward over time.
His projected blue path allows silver to decline into this area before a larger recovery. However, the drawn path represents his scenario, not future price data.
Silver would need to fall approximately 33% to 46% from $52 to reach his $35 to $28 range. That is a deeper correction than Kapoor’s proposed bottom near $37 to $39.
Patel Uses Previous Silver Crashes to Explain His Bullish Outlook
Patel’s chart marks earlier silver drawdowns of approximately 89.84% and 76.78%. These annotations provide the historical context for his argument that a severe correction can occur within a much longer market cycle.
The current chart includes a projected drawdown measurement near 71.59%, close to the blue demand zone. That helps explain why he allows for further losses despite the decline already recorded.
The red bearish order block begins around $89.37 and extends toward the marked high near $121.65. Those levels identify overhead resistance within his framework. The chart labels the bearish block as invalidated above its upper boundary.
Patel maintains a longer target of $300 to $500, although the drawn recovery extends across many years. His chart should therefore not be read as a promise of a rapid rebound.
Silver’s Next Direction Depends on Which Support Zone Holds
The analysts differ on timing and depth, but their downside levels provide a useful comparison.
Analyst Main Downside Area Broader Outlook Shitij Kapoor $37 to $39 Possible recovery toward $269, followed by further cycles Investing Angles $42 to $58 Stabilization possible, with deeper risk toward $25 Crypto Patel $28 to $35 Longer recovery target of $300 to $500
Silver’s first test is whether the current area can produce a durable base. Continued weakness would bring the lower zones into focus, although reaching any target would still require evidence of a reversal.
FAQs
Why is silver crashing?
Silver prices have crashed nearly 56% from their record highs—dropping to around $53.83 per ounce internationally and ₹1,92,800 per kg domestically—due to a mix of forced liquidations, surging energy costs, and shifting interest rate expectations.
Will silver hit $200?
Hitting $200 per ounce for silver is unlikely in the near term, as current market forecasts place silver prices around $54 to $63 per ounce, though some bullish analysts and figures like Robert Kiyosaki have speculated about a $200 target.
Subscribe to our YouTube channel for daily crypto updates, market insights, and expert analysis.
The post Silver Price Crash Not Over? Analysts Map Painful Drop Before Next Big Rally appeared first on CaptainAltcoin.