BITCOIN UPDATE: WHY IS BTC DROPPING AND WHAT CAN HAPPEN NEXT? (MUST READ) ⚠️ (PART 02)
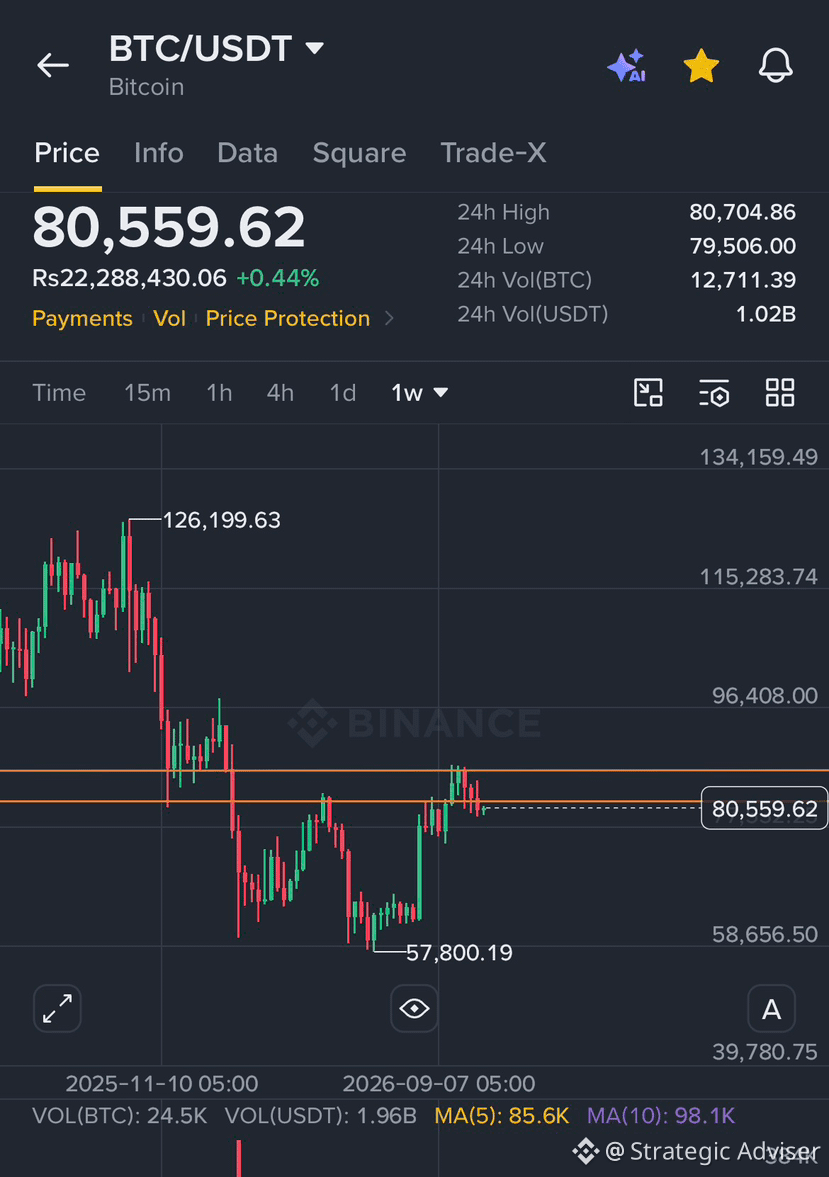
WHAT DOES ON CHAIN DATA TELL US? This is where things become more interesting. According to recent Glassnode data, the average cost basis of US spot Bitcoin ETFs is around $81.5K, while the True Market Mean is near $78K. At the same time, a large group of buyers from the previous 6 to 12 months has a cost basis around $88K. This means Bitcoin is trading near an important area where buyers may start feeling pressure if the price continues to decline. Another concern is that spot ETF demand has weakened, while leveraged positions have increased liquidation risk.
If spot buyers do not step in with enough strength, the market may struggle to sustain a recovery. But this does not automatically mean a crash is guaranteed. On-chain levels are areas to monitor, not fixed price targets.
WHAT CAN HAPPEN NEXT?
Another recovery Bitcoin could recover from the current support zone, especially if the Federal Reserve delivers a less hawkish message and buyers return to the market. But for me, a recovery alone is not enough to confirm a bullish trend. BTC needs to reclaim resistance with strong spot demand and sustained buying volume. Scenario Further downside If Bitcoin loses the $78K area and fails to reclaim it, the market could move towards the $74K $75K region.
CPI, STOCK MARKET AND THE FED The next major macro catalyst is the Federal Reserve’s October 27/28 meeting.
The market will be watching not only the rate decision but also the Fed’s comments about inflation and future policy. The next US CPI release is scheduled for November 10. If inflation remains persistent and the Fed signals that rates may stay higher for longer, this could continue to pressure Bitcoin and other risk assets. On the other hand, if macroeconomic pressure eases and spot demand improves, BTC could recover faster than many expect. MY FINAL VIEW I am still cautious about Bitcoin. I For now, I am watching the $80K / $82K support zone, the $78K level and the possibility of a move towards $74K / 75K.