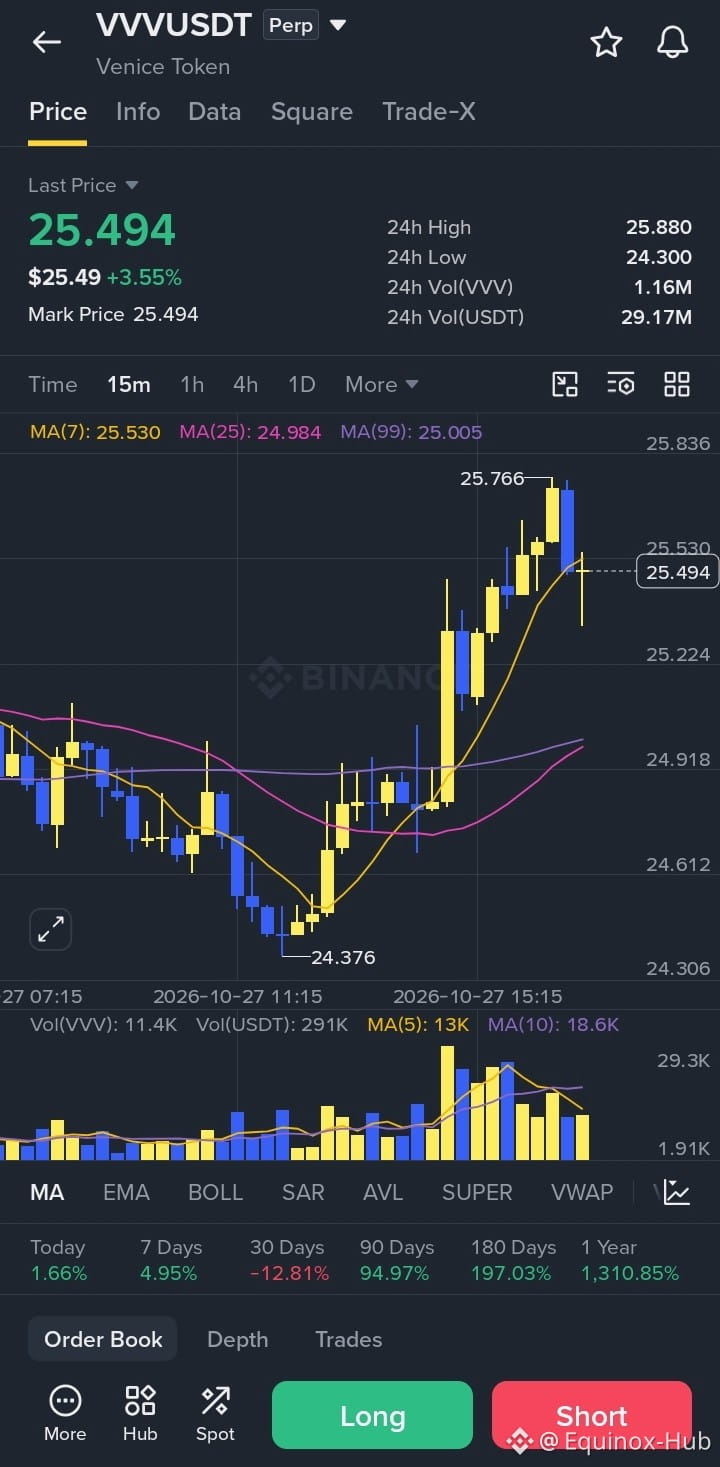
🔥 VVV just woke up hard.$VVV
From a clean dump into the 24.4 zone, buyers stepped in with force and are now printing consecutive strong green candles. Price is ripping +4.46% on the day and sitting right under the 24h high.
K-Line Analysis (1H)
Bottom structure: Clear rejection at 24.404. Multiple long lower wicks + strong recovery candles = demand zone defended.
Current structure: Series of impulsive green candles after the low. No real hesitation. Higher highs + higher lows forming.
MAs: Price already above MA5 (25.191), MA10 (24.979) and MA30 (24.943). All three are curling up — classic short-term bullish alignment.
Volume: Expanding on the green candles (especially the last push). Volume MAs also turning up.
MACD: DIF > DEA, histogram expanding positive (0.063). Momentum is accelerating, not fading.
Resistance in play: Immediate resistance is the 24h high 25.878. A clean break + hold above it opens the next leg.
This is a classic V-shaped recovery on the 1H with momentum confirmation.
Trade Plan (Spot / Swing bias)
Bias: Short-term bullish as long as price holds above 25.10–25.20 zone.
Aggressive Long (momentum play)
Entry: Current market (~25.65–25.70) or on minor pullback to 25.40–25.50
Stop Loss: Below 25.10 (under the recent structure + MA5)
Target 1: 26.20–26.40
Target 2: 27.00–27.50
Risk : Reward ≈ 1 : 2.5+
Safer Long (pullback entry)
Wait for retest of 25.20–25.40 (previous resistance now support / MA cluster)
Confirmation: Bullish candle + volume
Same stop & targets as above
Invalidation
If price loses 25.00 with volume and closes back under the MAs → the bounce is failing and we wait for the next demand zone around 24.40–24.60.
Right now the tape is bullish. As long as it stays above the MA cluster and volume keeps supporting the greens, the path of least resistance is higher. Watch the 25.878 break closely — that will decide if this becomes a real continuation or just a relief rally.