$SOL Perp Update: Holding the $100 Line, Breakout or Breakdown Next? 🎯
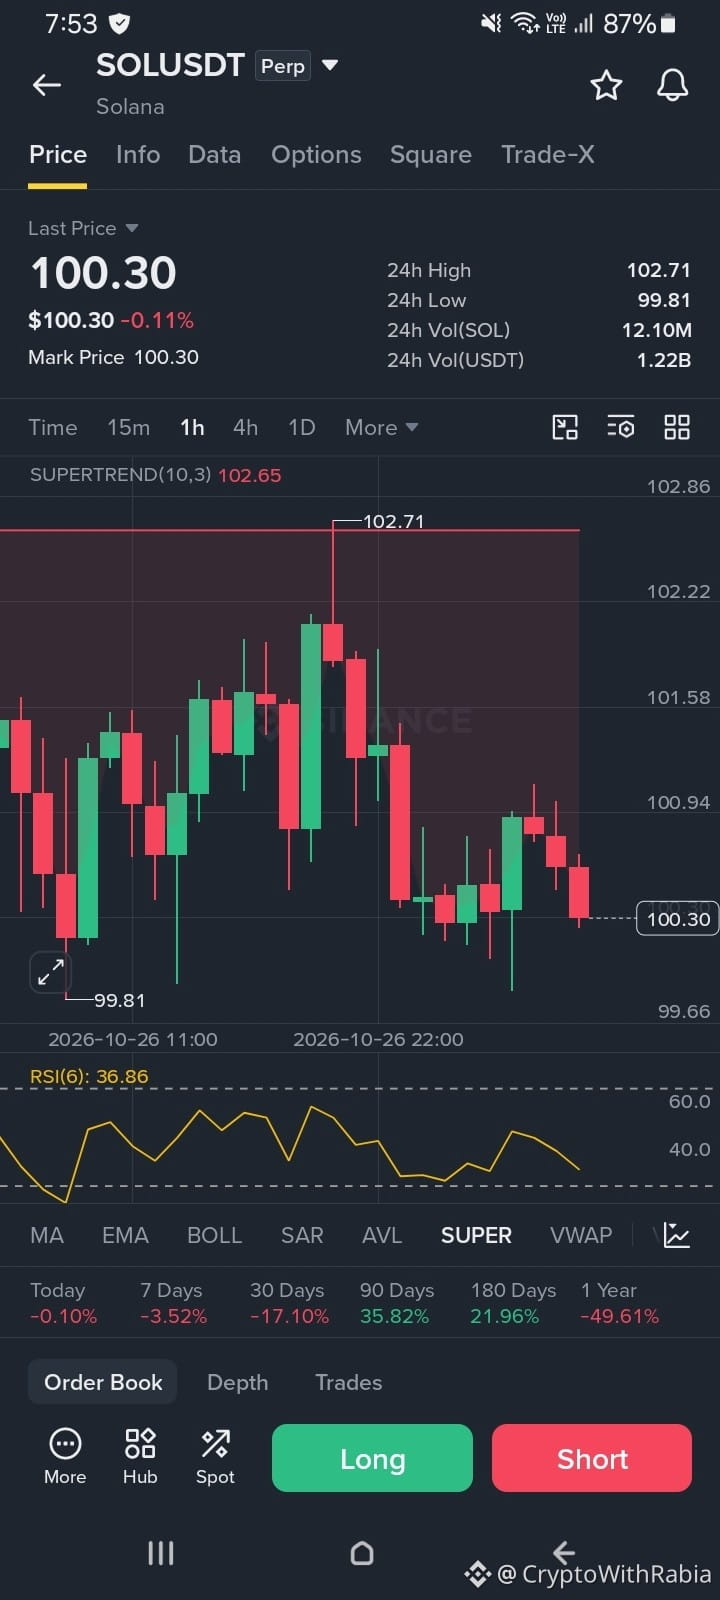
Solana (SOLUSDT Perp) is trading around $100.30, down -0.11% in the last 24 hours. The 24h range is $99.81 to $102.71, with strong volume of about $1.22B USDT.
Short-term view (1h chart):
• Price is compressing near the $100 psychological level after a rejection from $102.71
• Supertrend is bearish at $102.65, acting as strong overhead resistance
• RSI(6) is at 36.9, leaning bearish but not oversold yet
• Resistance: $100.94, then $101.58 and $102.65
• Support: $100.00, then $99.81 (24h low)
Bigger picture:
• Today: -0.10%
• 7 Days: -3.52%
• 30 Days: -17.10%
• 90 Days: +35.82%
• 180 Days: +21.96%
• 1 Year: -49.61%
SOL is stuck in a tight range with lower highs. Sellers control the short-term trend until the Supertrend line is reclaimed, but buyers keep defending the $99.81 zone. The longer this squeezes, the stronger the eventual move.
📊 Trade Plan (Example Only):
Long (support bounce):
• Entry: $100.00 - $100.30 (confirm with a green 1h candle)
• Stop Loss: $99.60
• TP1: $100.94
• TP2: $101.58
• Risk-Reward: approx. 1:2
Short (breakdown play):
• Entry: Below $99.80 with a 1h candle close
• Stop Loss: $100.45
• TP1: $99.20
• TP2: $98.50
Invalidation: For longs, a 1h close below $99.81 cancels the setup. For shorts, a strong 1h close above $100.94 invalidates the breakdown.
Tight ranges often fake out both sides, so wait for a candle close, keep size small, and use low leverage on futures.
Do you see SOL holding $100 or breaking lower? Comment your view below! 👇
Not financial advice. Always DYOR. Futures trading carries high risk.
#sol #cryptotrading #TradingSignals #TechnicalAnalysis #BinanceSquare
$SYN
$CHIP