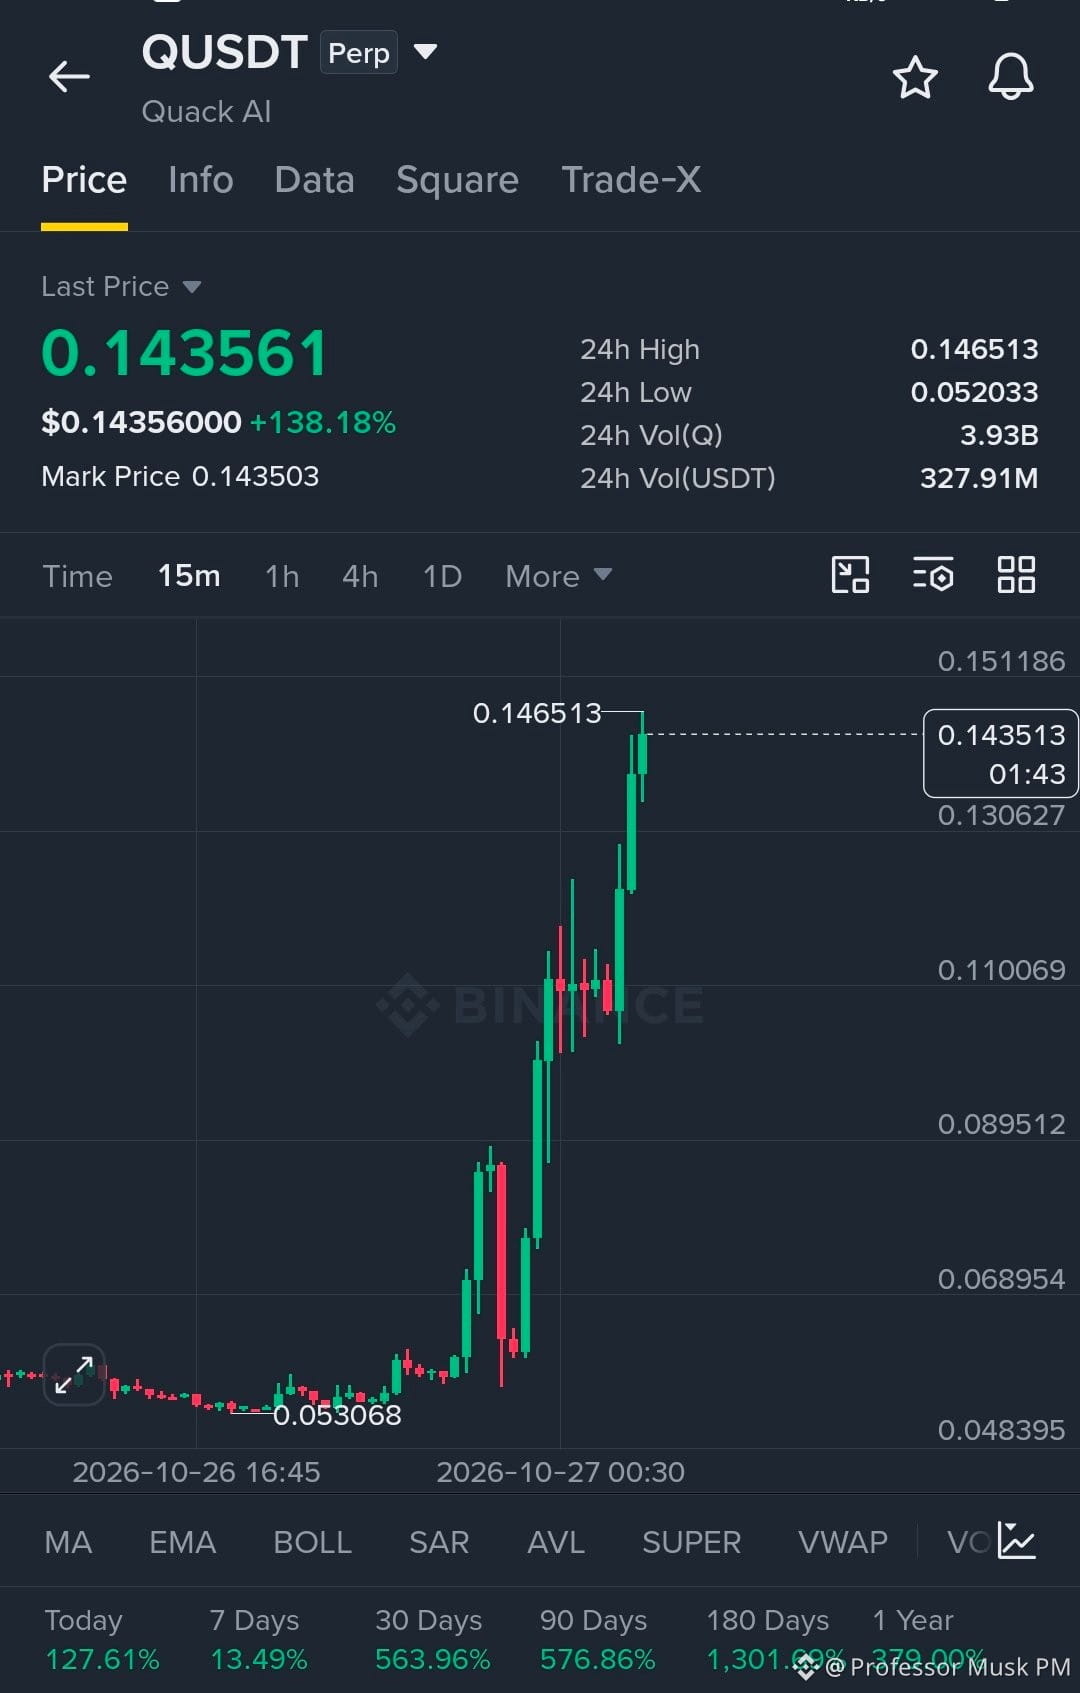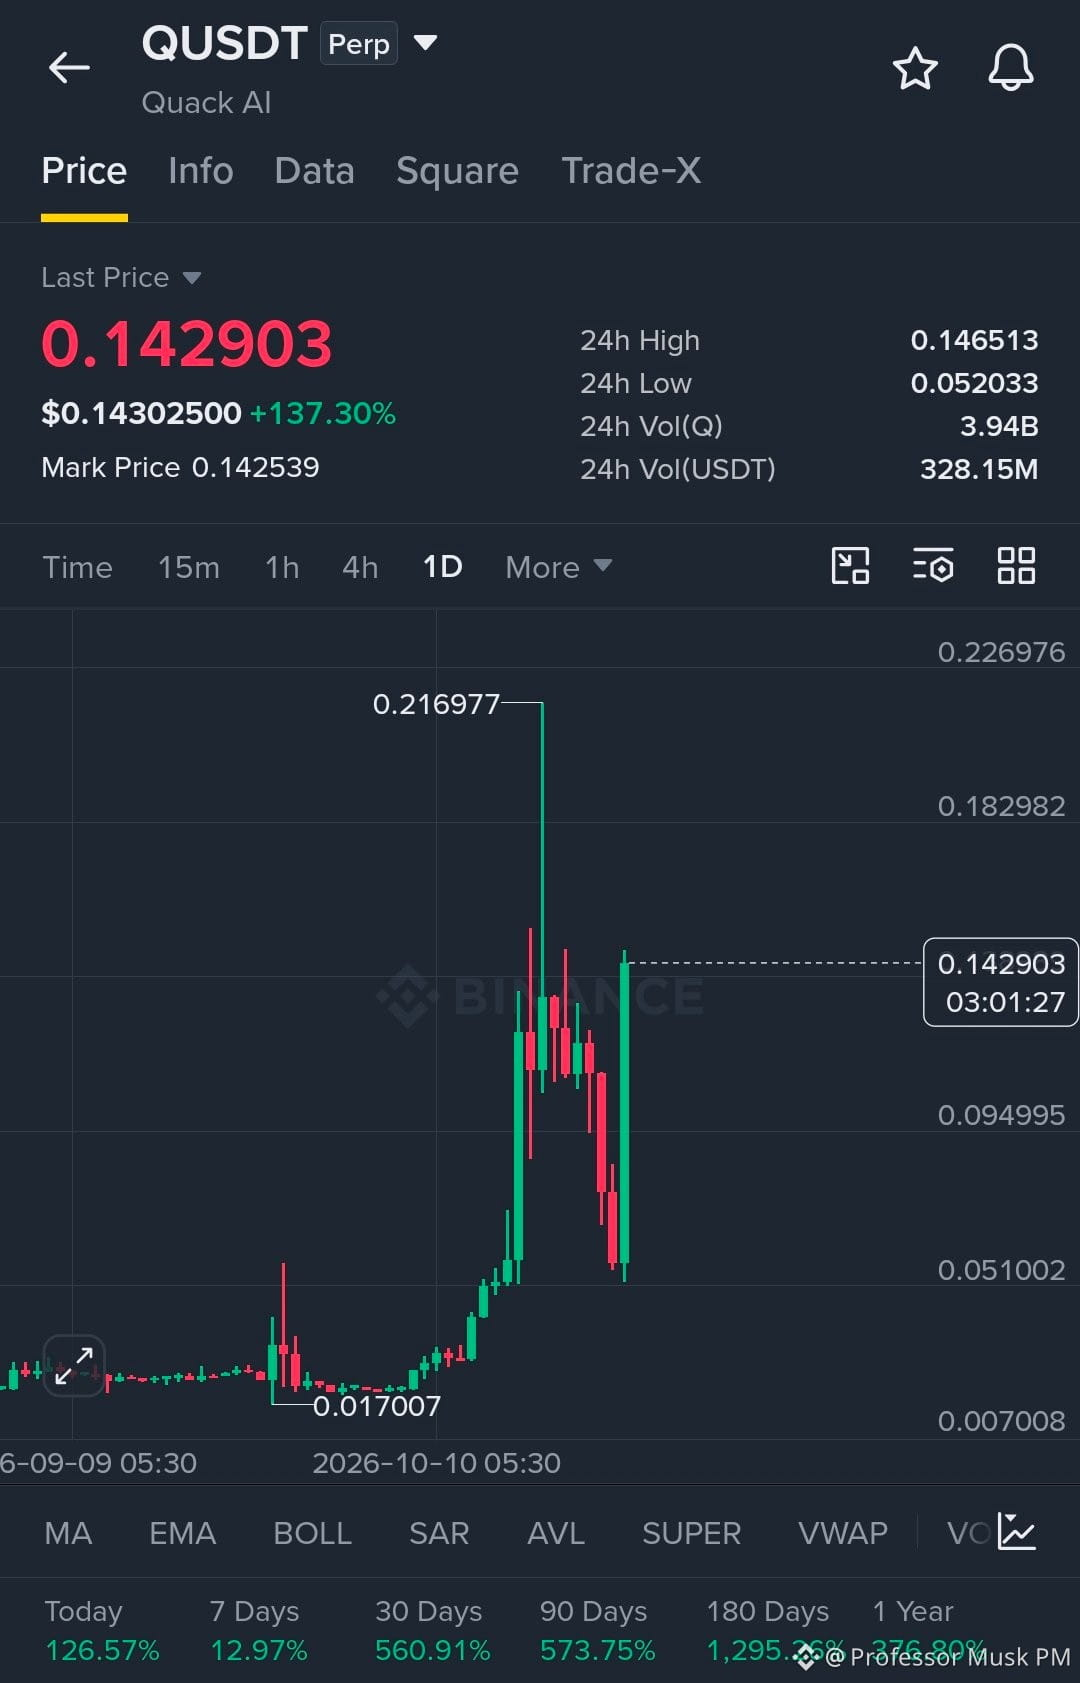
$Q Technical Analysis: 15m vs 1Day 📊
Contrasting the 15m micro chart with the 1D macro chart reveals the true market structure for Q. While the local view shows immediate resistance at 0.1465, the daily timeframe shows the major historic All-Time High sits much higher at 0.2169.
Q is holding a massive vertical rally, up +137% with over $328M in 24h volume.
🎯 Strategic Trade Setups:
📉 Where to Short:
• Local Scalp: 0.1465 - 0.1511 (Watch for M15 liquidity sweeps)
• Macro Supply: 0.2000 - 0.2169 (Strong daily resistance zone)
• Stop Loss: Daily close above 0.2200
• Targets: 0.1300, 0.0950, and 0.0510
📈 Where to Long:
• The Pullback: 0.0950 - 0.0890 (Safest dip-buy support block)
• The Breakout: Confirmed Daily close above 0.2170 with high volume
• Targets: 0.2500 and 0.3000+
🛡️ Parabolic Setup Rules:
Never short a vertical run based only on lower timeframes; always locate higher timeframe macro resistance first. Keep a close eye on the 24h volume (3.94B Q). If price prints new highs while volume shrinks, a buying climax is confirmed expect a sharp dump.
Always manage your risk tightly and watch the funding rates on perps.