DAILY SIGNAL — SOL/USDT
Date: 27 Oct 2026
Timeframe: 1m
Intraday Bias: Bearish continuation → downside Fibonacci targets
---
📊 Market Bias
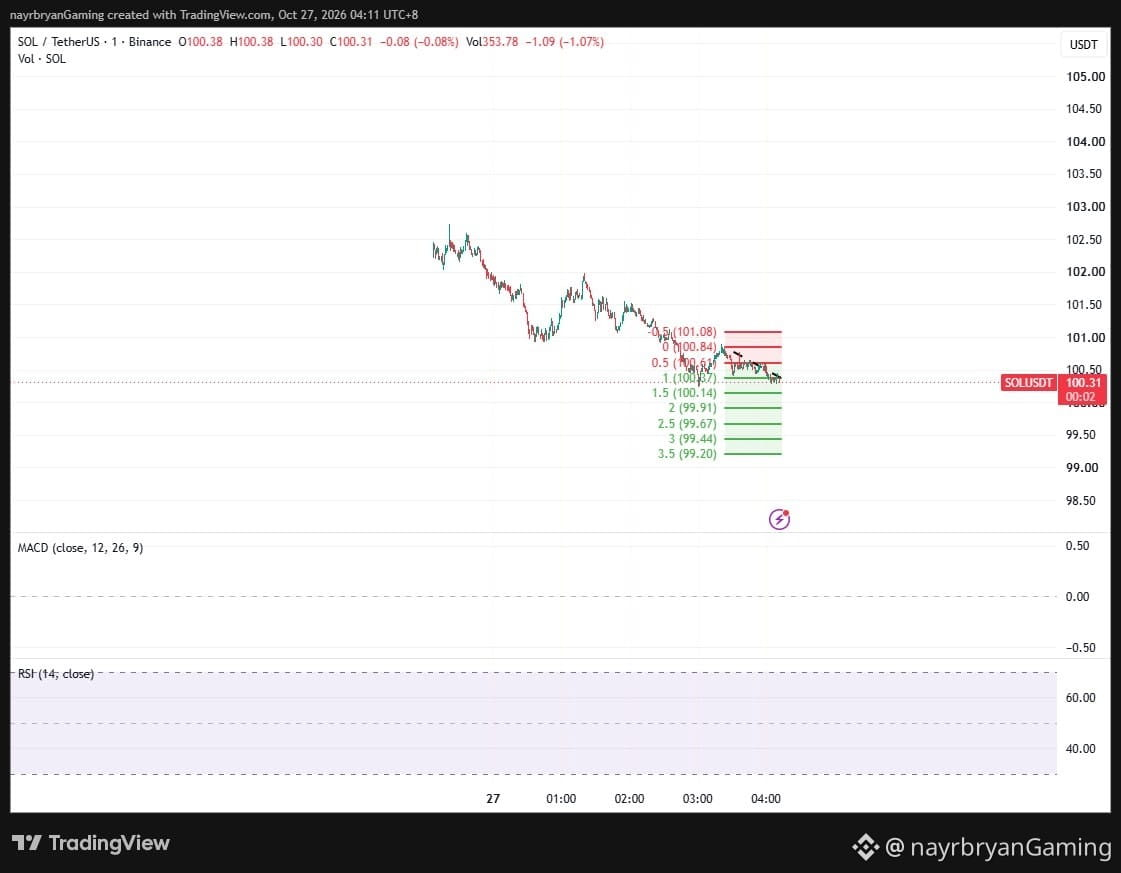
SOL is trading around 100.38 after declining from the 102.50–102.70 region and forming a clear descending channel.
Price has broken below the purple resistance zone around 100.80–101.15 and is consolidating beneath it.
The former support area has become a potential resistance zone. Unless SOL reclaims this structure, downside continuation remains the primary scenario to monitor.
---
🔹 Key Levels From Chart
Current Price:
100.38
Key Resistance Zone:
100.80–101.15
Immediate Resistance:
100.57–100.64
Channel Resistance:
Descending trendline above current price
Near-Term Support:
100.37–100.30
Major Downside Reference:
100.14
---
🎯 Fibonacci Levels
Downside Targets:
TP1 → 100.37 (0.5 Fib)
TP2 → 100.14 (1.5 Fib)
TP3 → 99.91 (2.0 Fib)
TP4 → 99.67 (2.5 Fib)
TP5 → 99.44 (3.0 Fib)
TP6 → 99.20 (3.5 Fib)
Invalidation Reference:
A sustained reclaim above 101.15 would weaken the immediate bearish structure.
---
📈 Technical Breakdown
SOL has formed a descending channel with lower highs and lower lows following rejection near 102.70.
Price subsequently lost the horizontal structure around 100.80–101.15 and is now trading below that zone.
The immediate focus is whether sellers can maintain control below 100.57–100.64.
A continued breakdown could expose the Fibonacci extensions at 100.14 → 99.91 → 99.67.
However, the chart's MACD and RSI panels do not display readable current indicator values, so their momentum readings cannot be reliably confirmed from this screenshot.
---
🧠 Quick Insight
“When support breaks, the next test is whether buyers can reclaim it. Until then, resistance deserves respect.”
---
⚠️ Disclaimer
This is personal market analysis, not financial advice.
This chart framework is for educational purposes only.
Always DYOR / DYODD, manage risk properly, and avoid emotional trading.
— @nayrbryanGaming
#SOL #SOLUSDT #Crypto #Trading #TechnicalAnalysis #PriceAction