$SOXLB
SOXLUSDT — Today's Analysis 📊
26 October 2026 · Market data snapshot
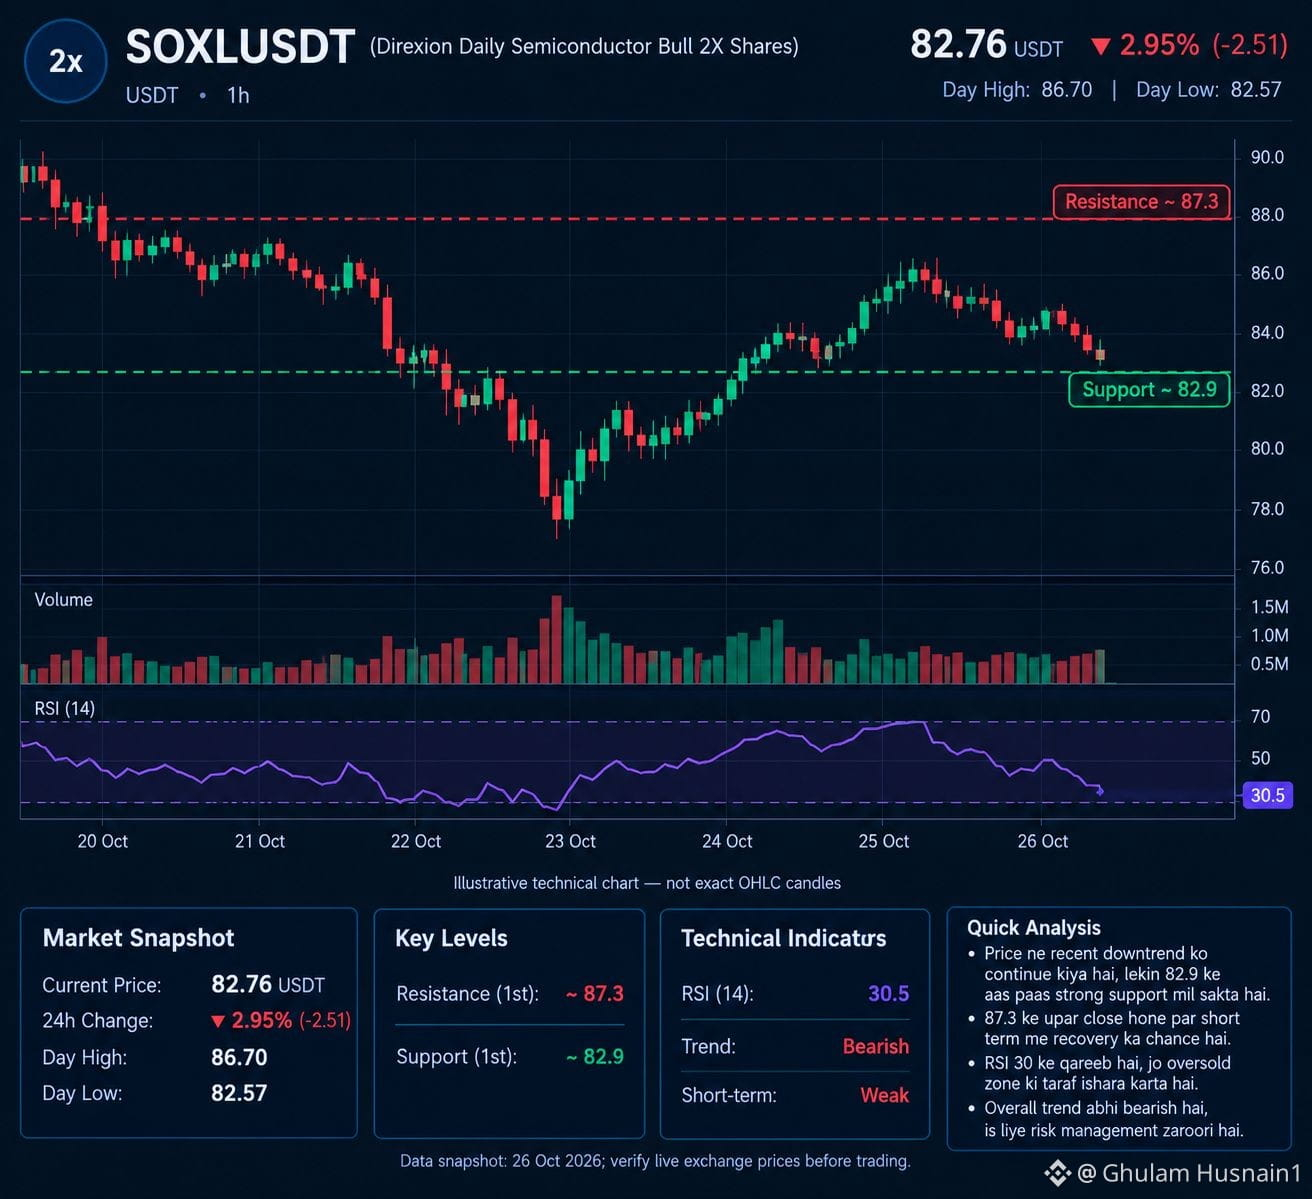
Current price
$82.76
24-hour change
−2.95%
24h High
$86.70
24h Low
$82.57
Source: Prices may vary by exchange and update time.
Short technical analysis
Trend: Bearish. Price has been declining, with selling pressure still present.
Support: Around $82.90. A break below this area could expose lower levels.
Resistance: Around $87.35. A move above this level may support a short-term recovery.
RSI: Approximately 30.5 on the daily chart, near oversold territory. A bounce is possible, but not guaranteed.
Outlook: Cautious to bearish until price shows a convincing recovery.
Possible trading scenarios
Condition What it may indicate
Holds $82.90 Potential short-term bounce
Breaks below $82.90 Further downside risk
Rises above $87.35 Recovery signal
My view: SOXLUSDT currently looks risky for a fresh long entry because the trend is bearish. Wait for confirmation rather than buying solely because the RSI is low.
Important: SOXL is linked to a leveraged semiconductor ETF, so its price can be highly volatile. Use a stop-loss and avoid excessive leverage. This is technical analysis, not a guaranteed trading signal.
#BinancePick #ArgentineCourtDismissesLIBRACaseAgainstMilei #BitcoinDunyamiz