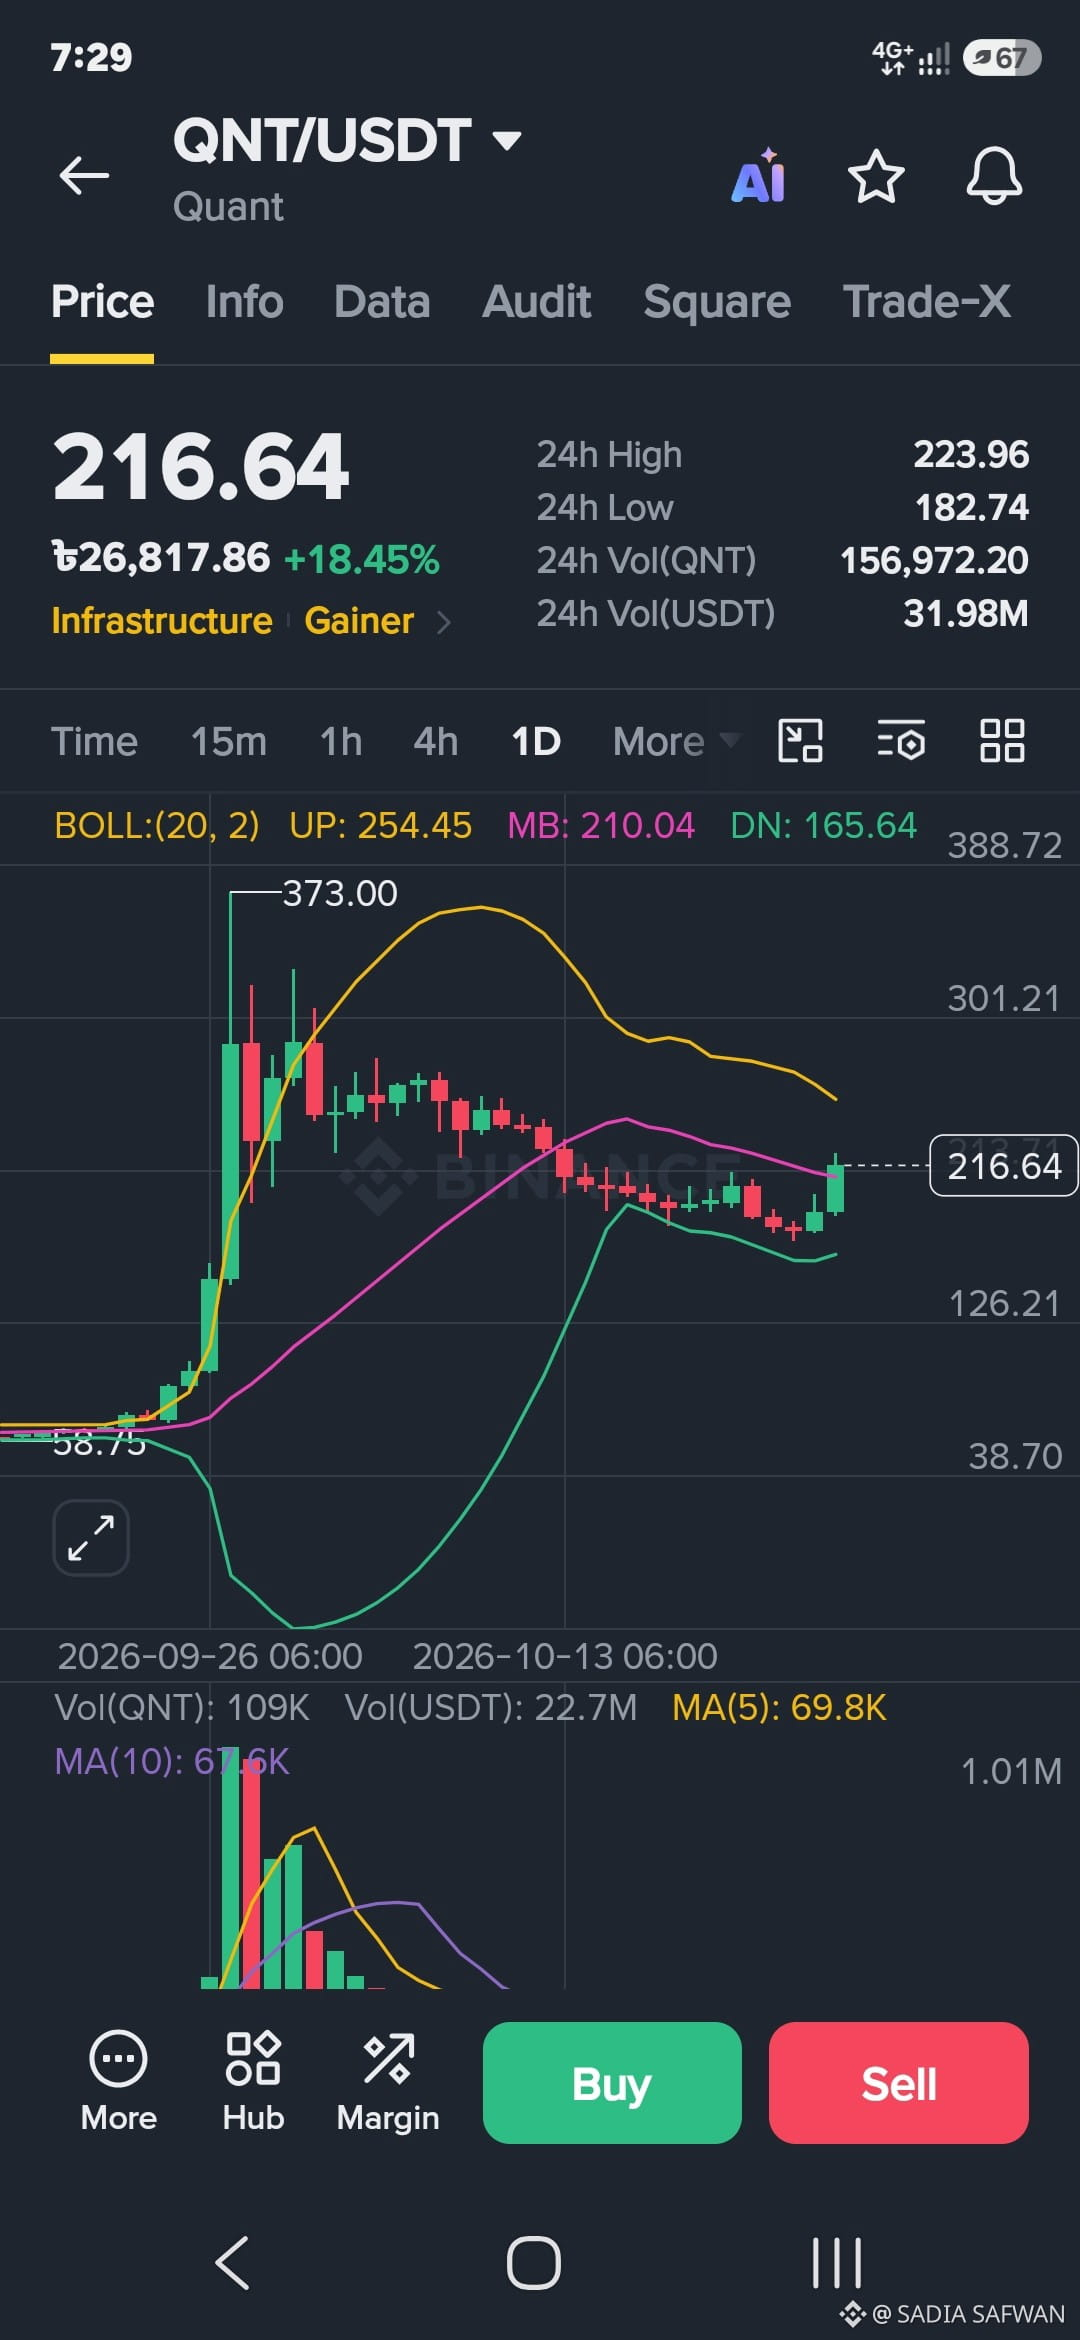
1. Price Action & Market Overview
Current Price: 216.64 USDT (equivalent to roughly ৳26,817.86).
24-Hour Change: Up +18.45%, showing strong bullish momentum for the day.
24-Hour Range: High of 223.96 and Low of 182.74.
Recent Trend Context: The chart highlights a massive explosive vertical rally earlier in the month that peaked at an all-move high of 373.00, followed by a healthy cooling-off/consolidation phase, and now a fresh bounce attempt.
2. Indicator Analysis
Bollinger Bands (BOLL: 20, 2):
Upper Band (UP): 254.45
Middle Band (MB / 20 MA): 210.04
Lower Band (DN): 165.64
Insight: The price has broken back above the Middle Band (210.04) and is heading toward the upper half of the bands. This signals that bullish momentum is trying to take control after the retracement.
ment.
Moving Averages (Volume Sub-chart):
MA(5): 69.8K
MA(10): 67.6K
Insight: Short-term volume moving averages indicate active buyer participation supporting the current push upward.
rd.
3. Key Levels to Watch
Immediate Support:
210.04 (The Middle Bollinger Band / 20-day Moving Average). Holding above this line is crucial to maintain short-term bullish structure.
182.74 – 165.64 (24h Low and Lower Bollinger Band) representing deeper support if a pullback occurs.
.
Immediate Resistance:
223.96 (24h High). A clean break above this level opens up room toward the 254.45 Upper Bollinger Band resistance.