SNDK looks weak, but I need to see more proof.
🔴 SHORT $SNDK /USDT: expecting price to go DOWN
Bias: SHORT · Leaning
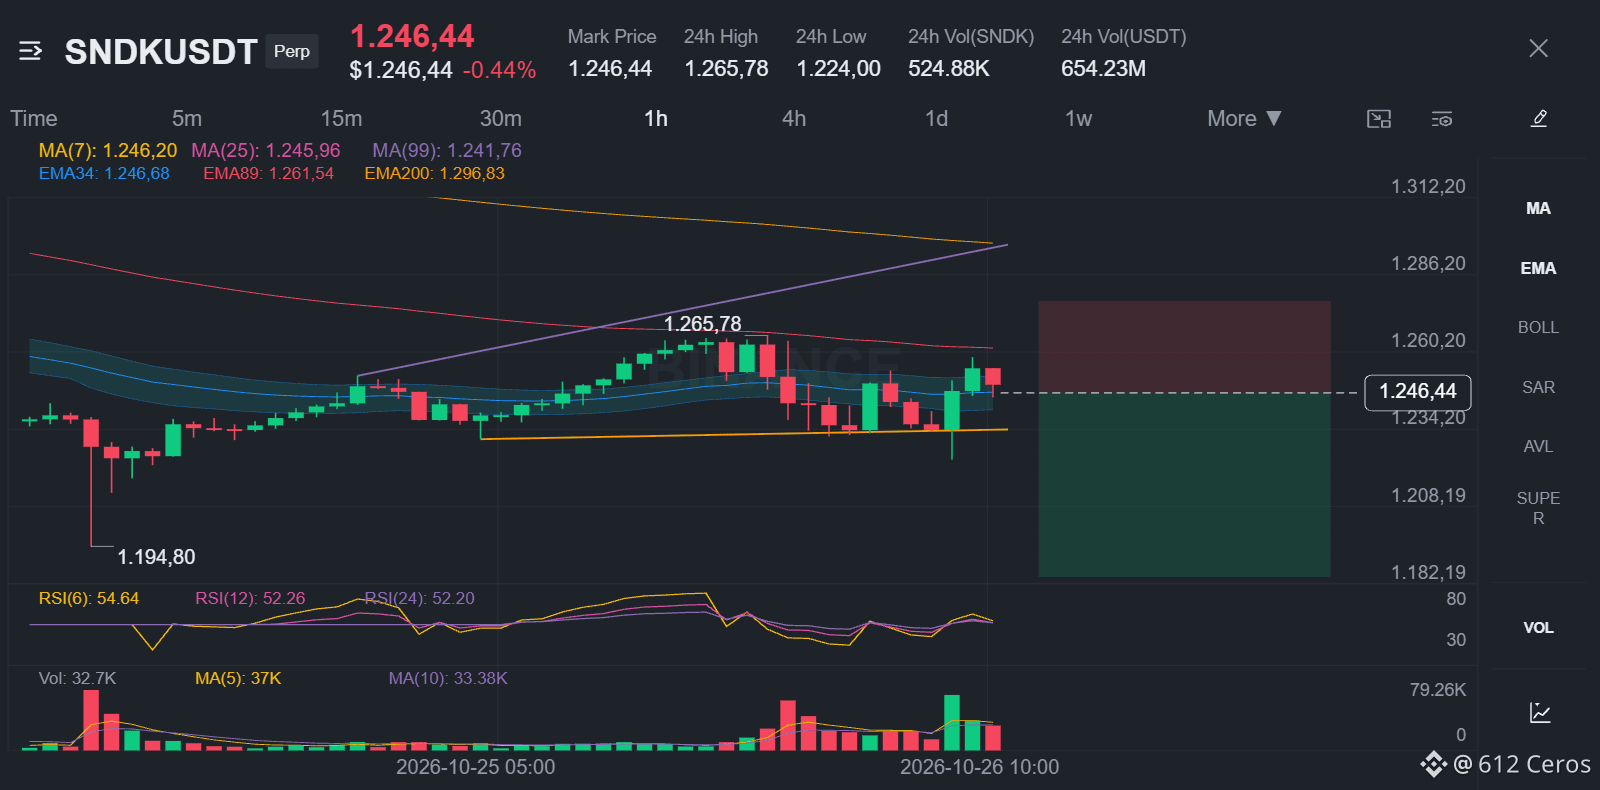
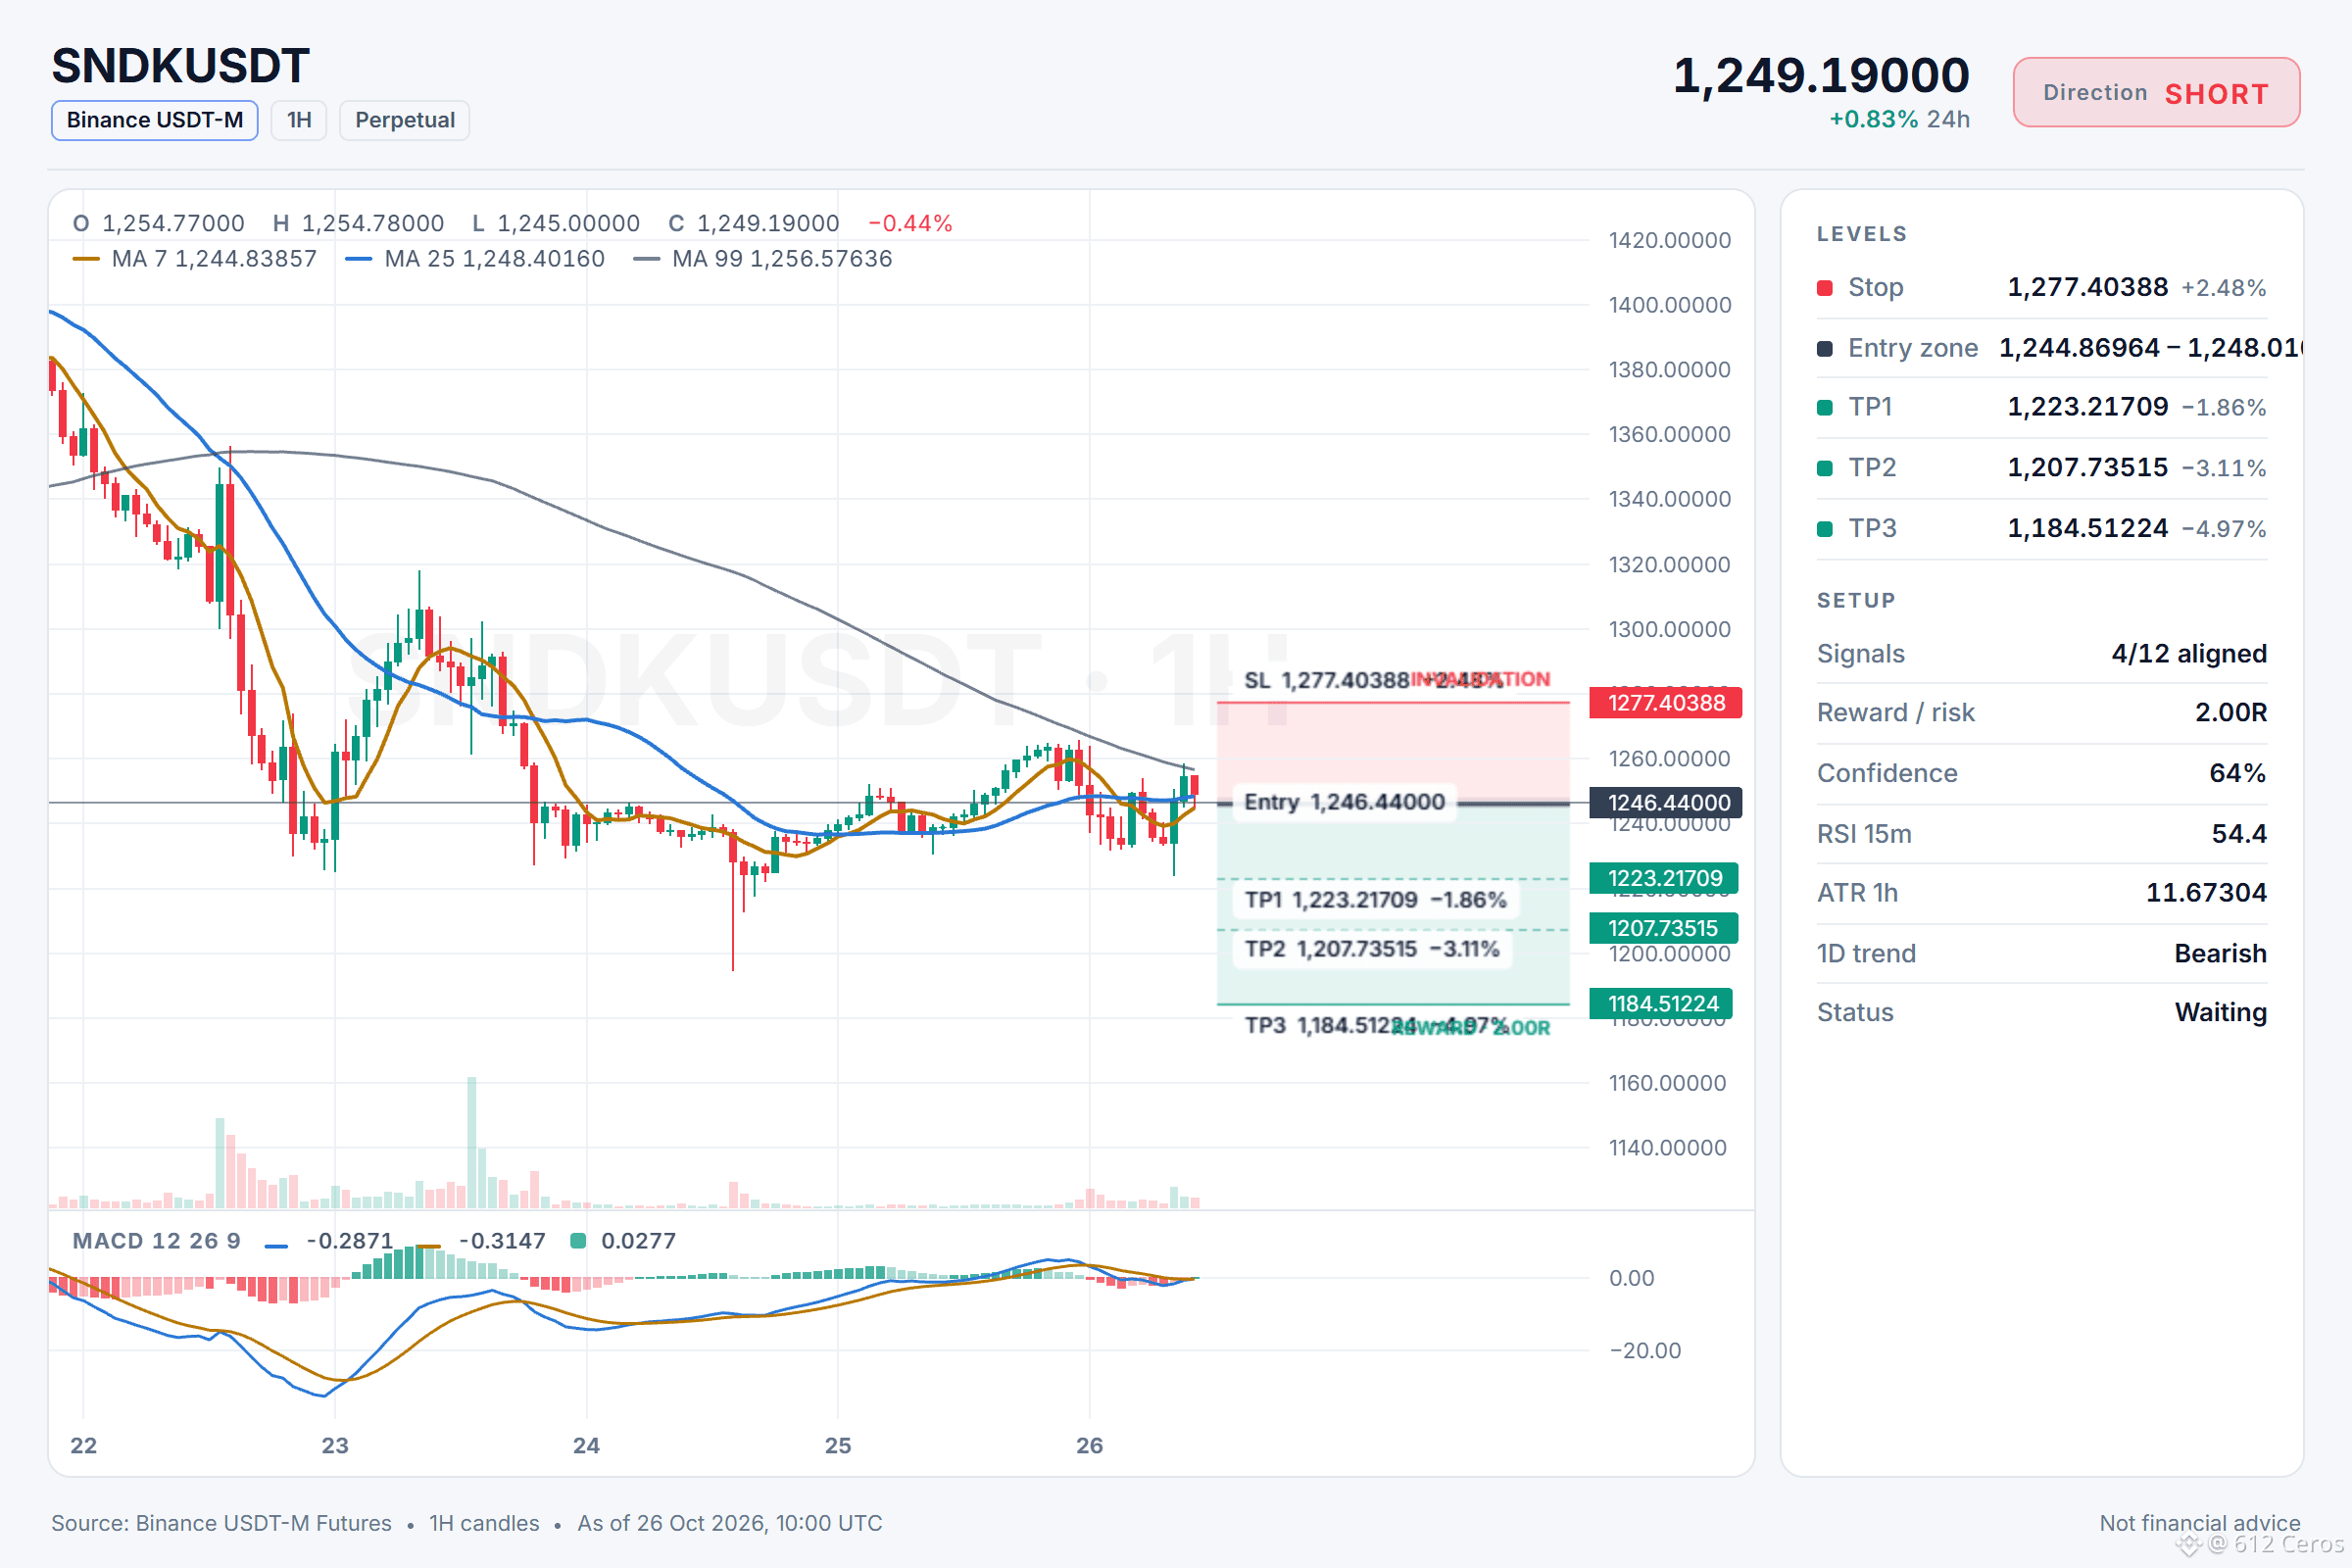
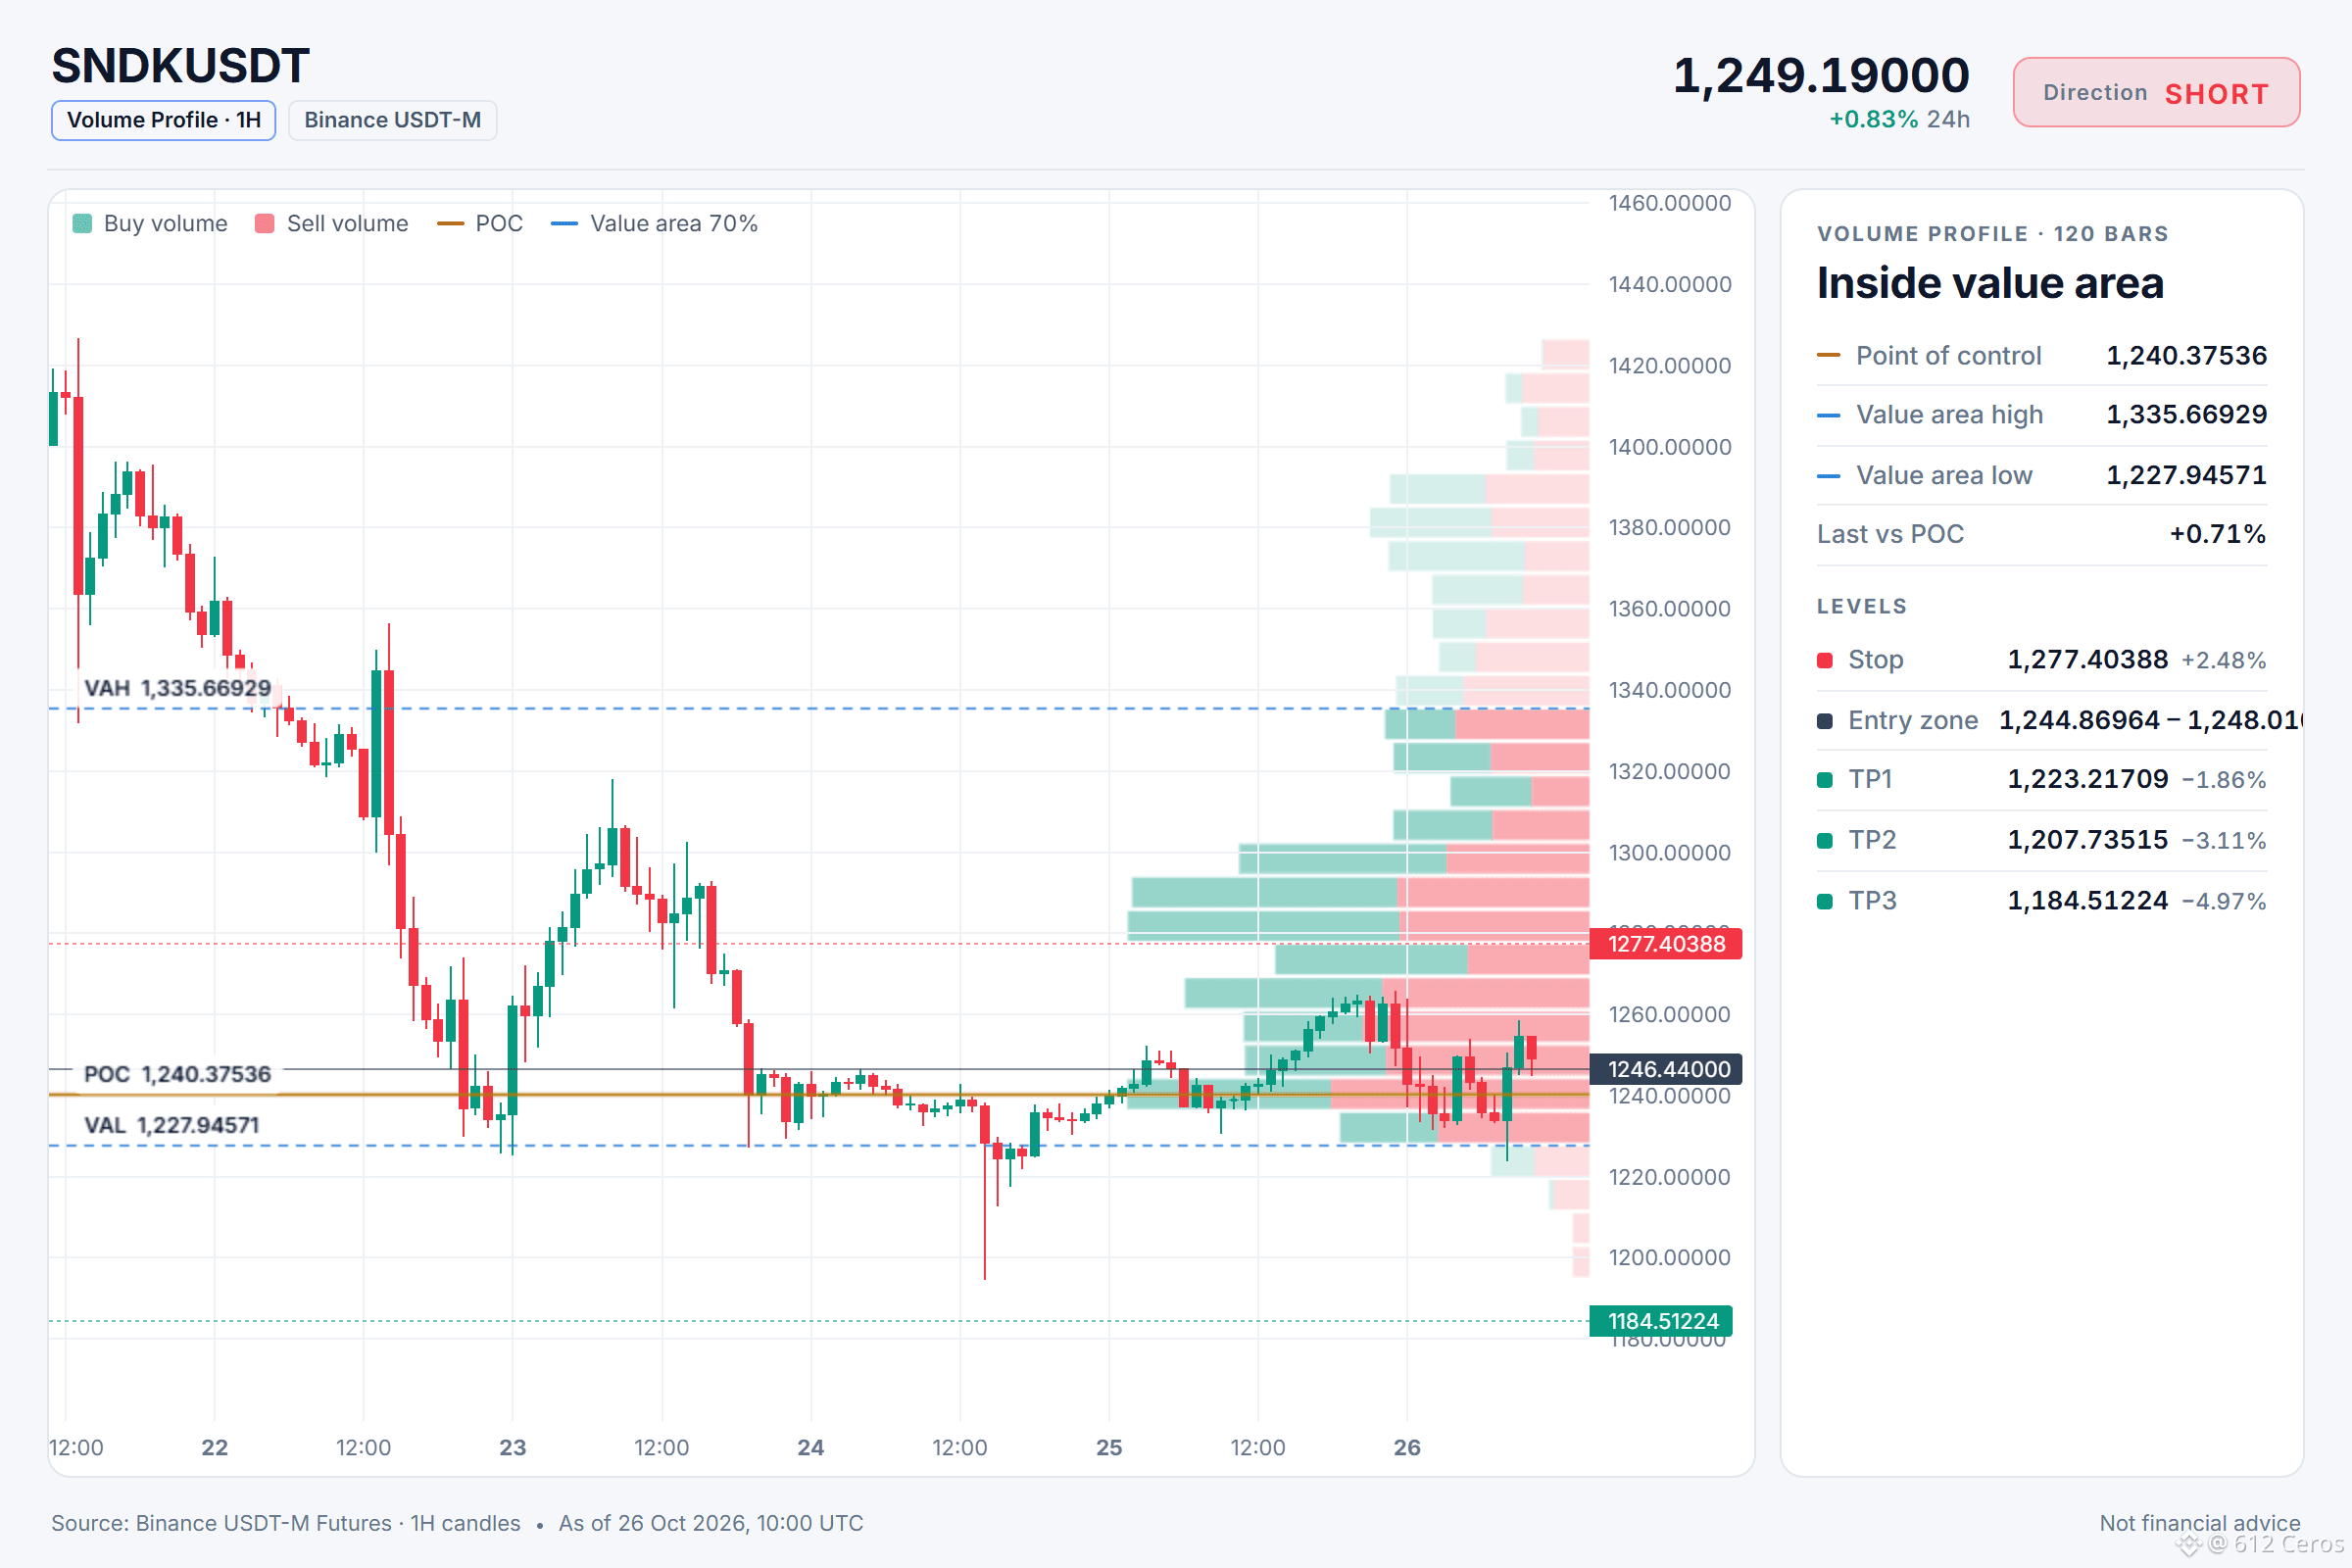
Entry: 1244.86964 – 1248.01036
TP1: 1223.21709 (-1.9%)
TP2: 1207.73515 (-3.1%)
TP3: 1184.51224 (-5.0%)
SL: 1277.40388 (+2.5%)
Plan: enter only inside the zone, close 50% at TP1, 25% at TP2, 25% at TP3, and move the stop to entry after TP1.
Note: moderate conviction only, keep size light.
Why SHORT? 4/12 signals agree, 1 against.
• Daily trend down (below EMA50 & EMA200)
• 4h trend down (below EMA50 & EMA200)
• 1h trend down (below EMA50 & EMA200)
Risk: BTC is rising, this coin follows (corr 0.62)
Journal note: SNDK
I'm watching SNDK for a short trade. The daily trend is bearish and the 4h trend is bearish too, which means the big and swing picture are both down. I want to see price hold below the 1h EMA50, currently 1246.44, before I take it.
Where would you set your invalidation level?
Full setup on the chart below.
📲 Want more of my latest signals? Join me here:
https://app.binance.com/uni-qr/D26WbL9t
⚠️ Personal market analysis only. NFA — manage risk and DYOR.
Educational content, not investment advice or a recommendation to buy, sell, deposit, or withdraw any asset. No paid promotion or referral/affiliate links.