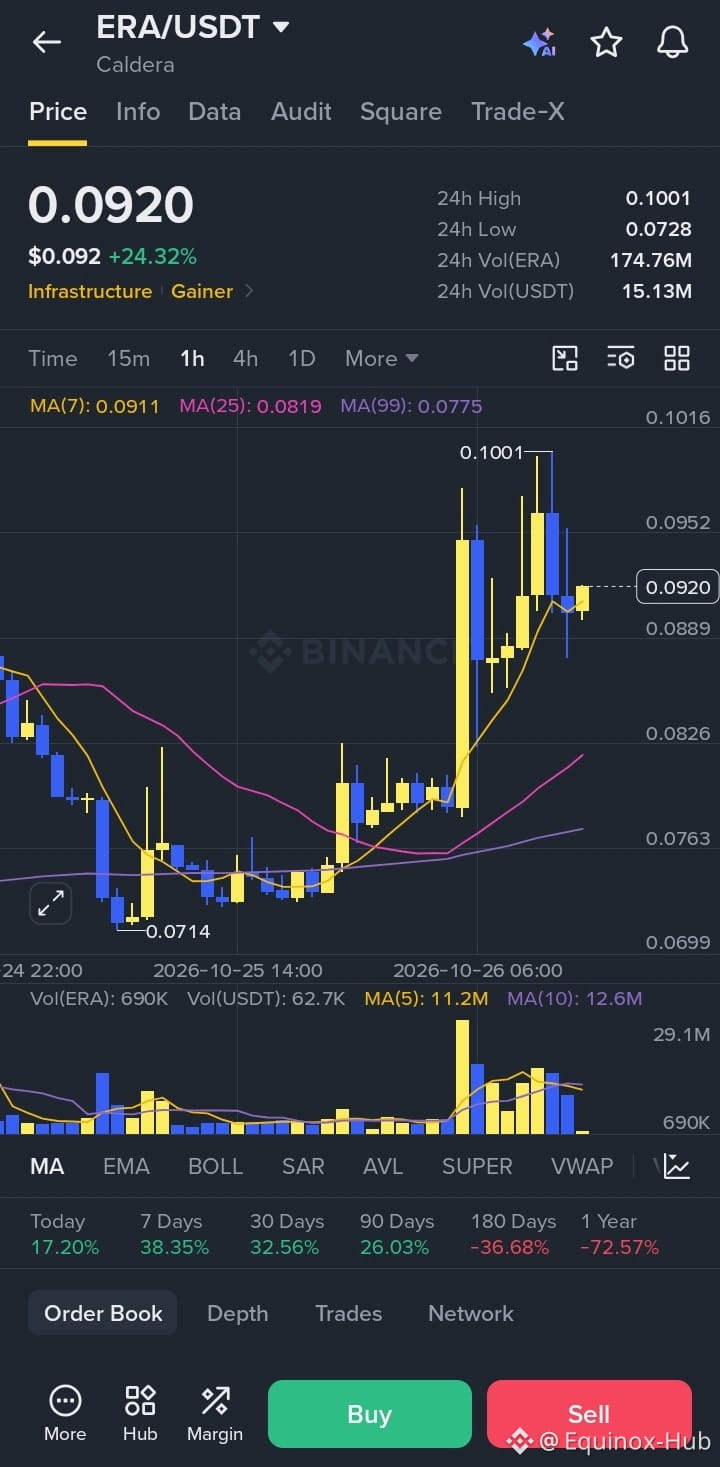
📊 Current Market Snapshot
$ERA
· Asset: ERA (Caldera)
· Current Price: $0.0920
· 24h Change: +24.32% (Significant bullish momentum)
· 24h High / Low: $0.1001 / $0.0728
· 24h Volume (USDT): 15.13M (High trading activity)
📈 Technical Analysis .
1. Massive Breakout: The chart shows a strong bullish breakout. For a period, the price was consolidating near the bottom ($0.0714 support level). Suddenly, a massive green candle pushed the price up, breaking through resistance levels and reaching a high of $0.1001.
2. Moving Averages (MA):
· The price is currently trading above the MA(7) [yellow line at 0.0911], MA(25) [pink line at 0.0819], and MA(99) [purple line at 0.0775].
· Golden Cross: The short-term MA(7) crossing above the longer-term MA(25) and MA(99) indicates strong short-term buying pressure.
3. Current Pullback: After hitting the high of $0.1001, the price has pulled back and is currently consolidating around the $0.0920 mark. This is a common "retest" phase after a rapid surge.
4. Volume: The volume bars at the bottom show a massive spike corresponding with the price surge. This confirms strong market interest and "smart money" buying. However, volume has slightly decreased during the current consolidation phase.
⏳ Multi-Timeframe Performance
· Short-term (Today & 7 Days): Very Bullish (+17.20% and +38.35%).
· Mid-term (30 & 90 Days): Bullish (+32.56% and +26.03%).
· Long-term (180 Days & 1 Year): Bearish (-36.68% and -72.57%).
Key Takeaway: This is a strong short-term recovery, but the asset is still down significantly from its longer-term historical prices.
🔍 Things to Watch
· Resistance: The immediate resistance is the recent high of $0.1001. If it breaks above this, it could continue to climb.
· Support: The current support zone is around $0.0890 - $0.0910 (the MA7 level). If it breaks below this, the next strong support is around $0.0819 (MA25).
· Overbought: The RSI is not shown, but a +24% move often leads to short-term exhaustion. Traders might take profits, causing a deeper pullback.
#ERA