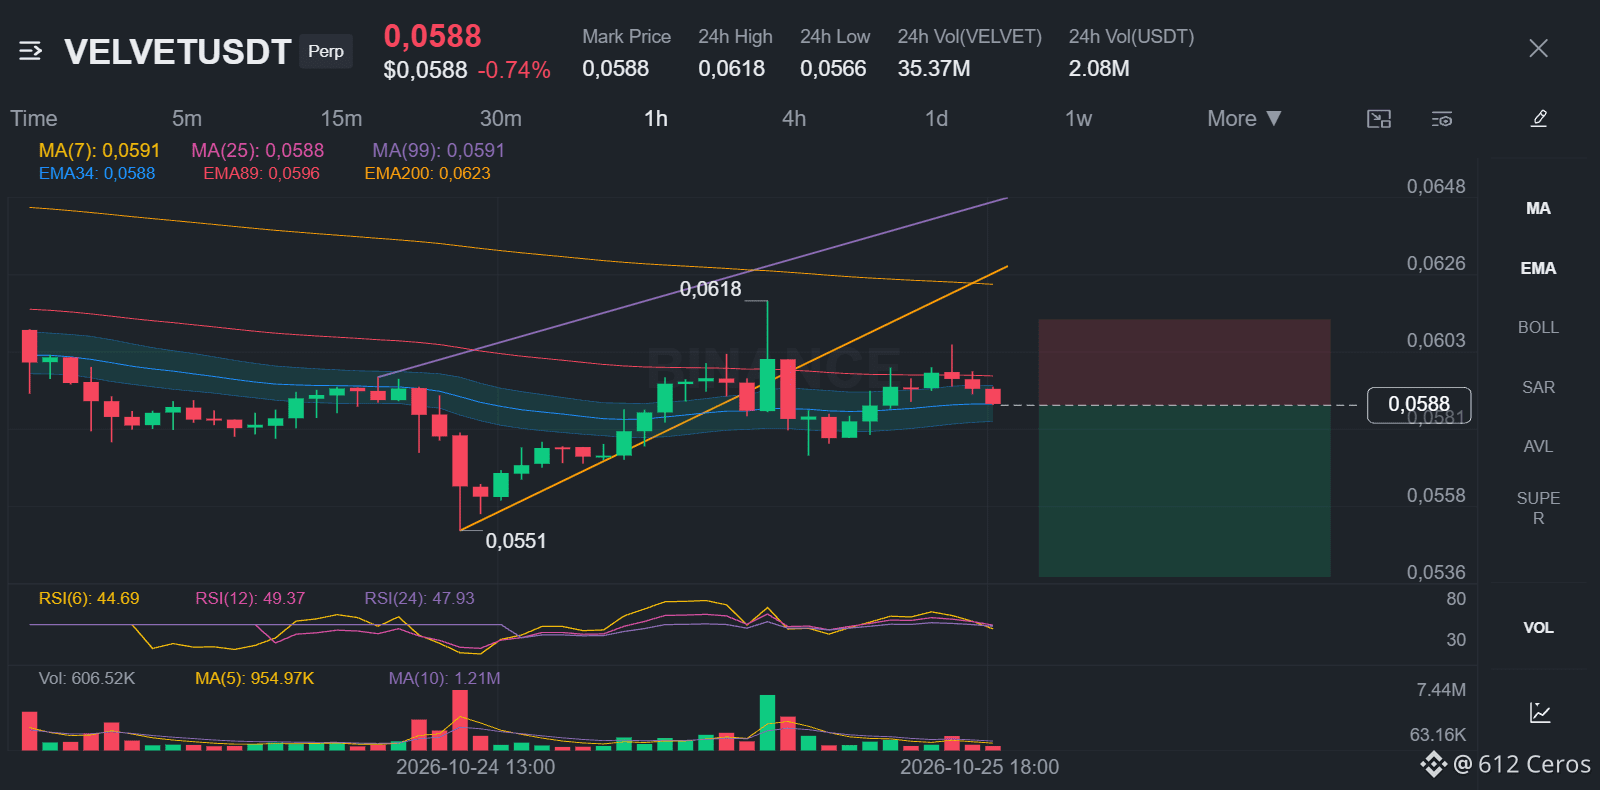
VELVET sliding into stacked EMAs across all timeframes
🔴 SHORT $VELVET /USDT: expecting price to go DOWN
Bias: SHORT · Leaning
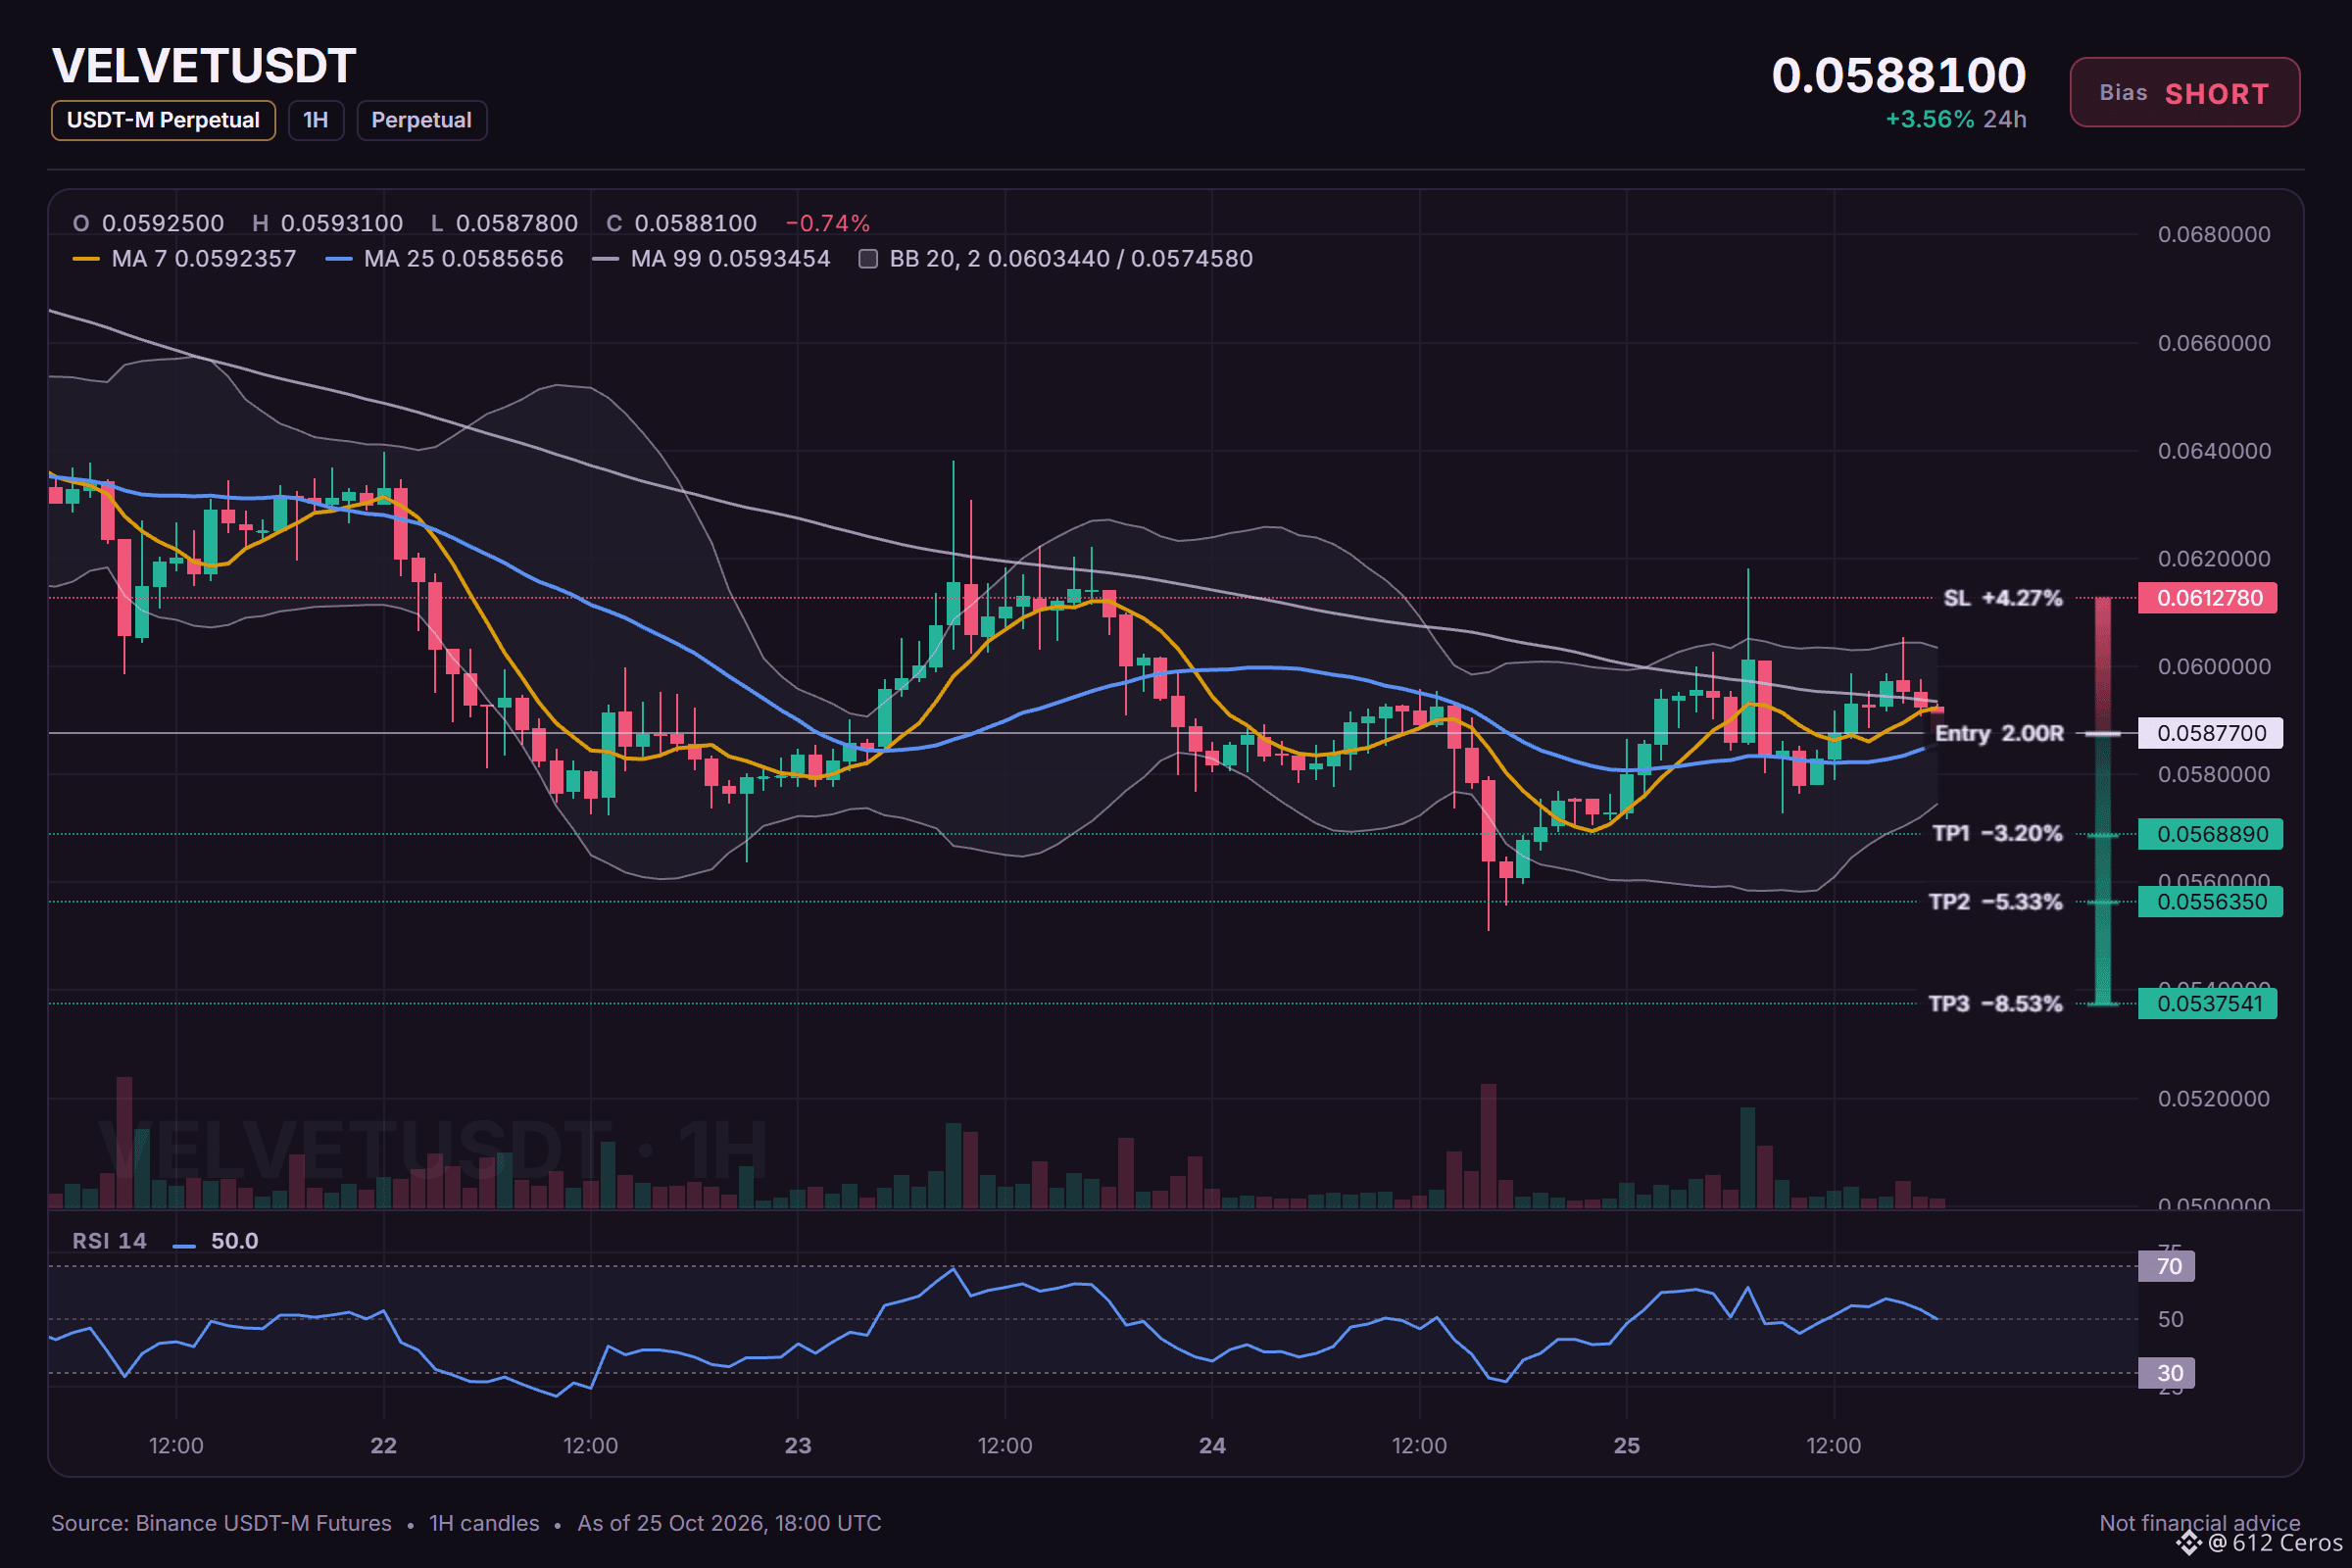
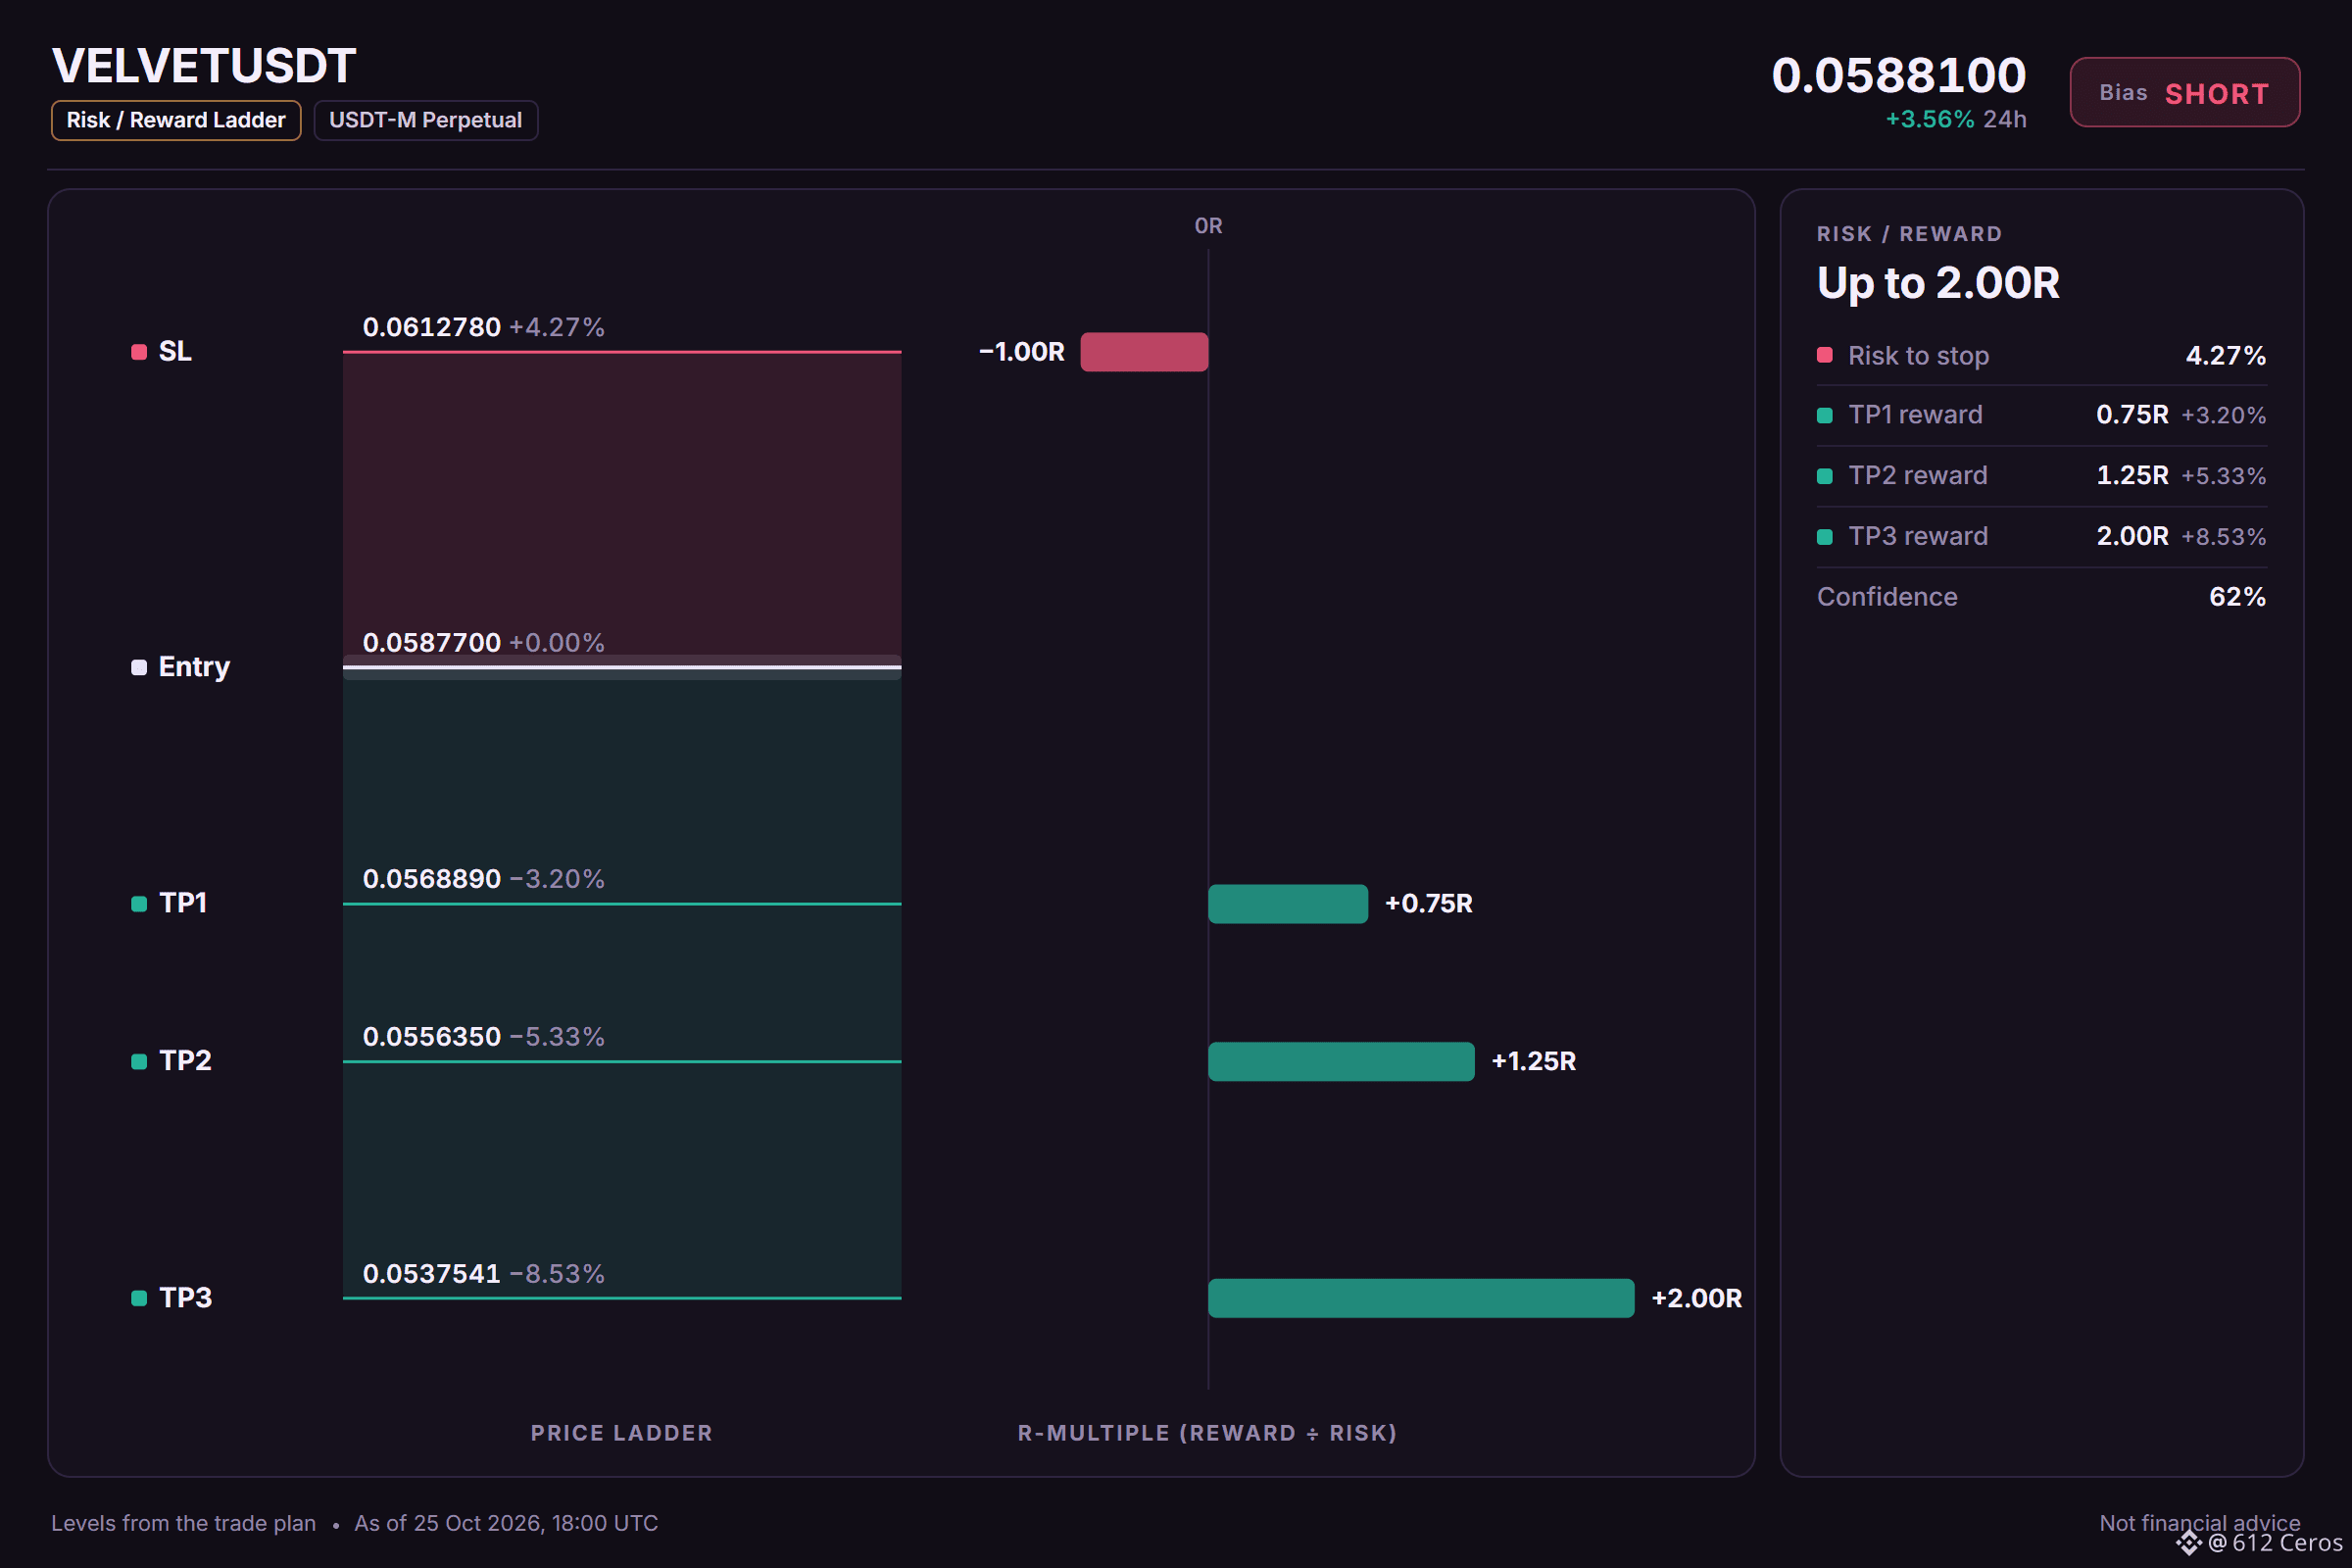
Entry: 0.0586697 – 0.0588703
TP1: 0.0568890 (-3.2%)
TP2: 0.0556350 (-5.3%)
TP3: 0.0537541 (-8.5%)
SL: 0.0612780 (+4.3%)
Plan: enter only inside the zone, close 50% at TP1, 25% at TP2, 25% at TP3, and move the stop to entry after TP1.
Note: moderate conviction only, keep size light.
Why SHORT? 3/12 signals agree, 1 against.
• Daily trend down (below EMA50 & EMA200)
• 4h trend down (below EMA50 & EMA200)
• 1h trend down (below EMA50 & EMA200)
Risk: Stronger than BTC (+3.18% 24h vs BTC)
The reasoning:
VELVET shows a bearish stack on the daily and 4h charts, which means the big picture and swing trends are both down. The 1h chart also shows price below its stacked EMAs, confirming the short-term trend is down, so a short setup fits the structure. The daily trend is bearish and the 4h trend is bearish, which together point to continued downside pressure.
What is your invalidation level for this short setup?
Levels mapped on the chart below.
📲 Want more of my latest signals? Join me here:
https://app.binance.com/uni-qr/D26WbL9t
⚠️ Personal market analysis only. NFA — manage risk and DYOR.
Educational content, not investment advice or a recommendation to buy, sell, deposit, or withdraw any asset. No paid promotion or referral/affiliate links.